AEP in the Telepgraph also thinks the Greeks are being short changed
Next week earning season in stocks begins with Alcoa on Monday. In January the market rallied hard into earnings and then sold the news. However the indices have huge upward momentum and every junk stock has a bid under it so it is hard to see us falling from here, with out at least a spike up to test the big numbers the market is all looking at and “Mutual Fund Monday” looks set to continue its bull run. Stocks have their biggest sustained run up since April 2009 but most interesting is the CoT report which show that last week for the first time in much more than a year the small speculators are now net long the e-mini S+P (apart from a brief week last August). And for the first time Since October 08 large speculators have gone from net long to net short. This is a pretty good indicator for me, small speculators in the emini are the small investors and are usually the last ones to the party before the booze runs out as they buy as the trend is exhausting and we could be looking at a (probably brief) trend reversal in the indices. Not right away but one to watch, for sure. In the Globex S+P and cash S+P all the groups are bunched up and balanced almost evenly, the last time this happened was Aug/Sep 08 before the big drops.
Other upcoming new this week are even risks for the dollar: budget statement Monday; Trade Balance Tuesday; CPI + advance retail sales + Fed Beige Book + Bernanke Testimony Wednesday; Industrial production Thursday: and finally Housing and U Mich confidence survey Friday. Other currencies have a quiet news week apart from Bank of Japan meeting minutes Sunday night and Canadian 1Q future sales outlook on Tuesday.
Time for some charts

Uptrend – Price is still contained in an ascending channel and is technically still in an uptrend however the big rebound in EUR on Friday (which is a big % of this index) caused a big pullback Friday and what could be a lower swing high. If the dollar does not rebound Monday and breaks this support line we could be seeing some more dollar losses or sideways trading in the week ahead.
S+P Futures -
Weekly bullish continuation, daily bullish, upward momentum appears to be accelerating. The strong uptrend is still intact and buy on dips seems to be the way to go for a test of 1200 and higher. No price action to be short at all (yet) but this is earnings season and expect the unexpected.
FTSE 100 futures – Trend is bullish but chart has a weekly hanging man at the 1.27 fib extension. Friday rallied but failed to make a new high like the US US

Weekly spinning top after making new highs, daily is bearish but has found support and closed on last weeks high. This pattern is interesting because a bearish weekly candle this week will then be an evening star reversal pattern on the weekly chart and suggests deeper correction to come. Bears will say they are in charge because we closed below 85 but Bulls will say we closed above last weeks high. I favour the short side for the short term only and because April is seasonally a weak month for crude. Then I will be looking to buy with a target of 90 then 100.

Gold is strongly bullish, has broken out from a wedge formation and is testing the neckline of a large head and shoulders pattern. Pattern failures can be great trades but it would be stupid to ignore the trend. Gold is a buy on dips or a break of the neckline support and looks all set to test the previous highs above 1200 with resistance on the way at 1195. If gold pulls back I would look for price action in the 1141.50 or 1118 area to buy.
SILVER. Like gold the chart is strongly bullish and pattern suggests we will exceed last Nov high of 19.45. I would buy dips and if price pulls back would look for price action at 17.65 (or unlikely but 16.25) to get long. Resistance at 18.85
Currencies - Majors
AUDUSD

Note that if the dollar rallies hard as the week starts this could come all the way back to 92 or 92.20 before continuing higher. Below 92 suggests a false breakout and would be a bearish signal for AUDUSD.
Important to note also that the RBA are rumoured to be getting ready to sell AUD here to weaken the currency and that's reason enough for me to stay out for now
Important to note also that the RBA are rumoured to be getting ready to sell AUD here to weaken the currency and that's reason enough for me to stay out for now
NZDUSD – Weekly bullish engulfing, daily long bullish marabuzo. This is the weakest of all the commodity currencies but the AUDNZD chart suggests the NZD may outperform AUD as it looks set to pullback but only for a little while. Price is still contained in a descending channel / bull flag pattern and I am watching for price action as it tests the top at around 0.7150 – 0.72 for a short swing trade. If it breaks out above 0.72 then my bias will change to bullish. If you wanted to get long before then I would buy a pullback and retest of 0.7100.
USDCAD – Weekly bearish continuation, daily a long legged doji. Finally price broke below the magic 1.00 level but less good than expected employment numbers and no doubt some profit taking meant it failed to close below the par number. I am speculatively long looking for a countertrend bounce here but its fighting a strong trend down and a close below last weeks low and I am out.
GBPUSD –
Fair warning – euro could be volatile this week with Greek euphoria and the cross EURGBP is a big driver of cable which could mean some drag on it, especially in the London sessions. We could have a bigger than expected pullback in cable as a result.

Weekly bullish long legged doji and daily bullish marabuzo this pair was lifted on rumours of possible assistance for
USDJPY – Weekly inside bar, daily bearish doji. USDJPY looks to have found support at the 0.93 SR level and could be set for another leg up here. I have not bought off this level (yet) as I was expecting a deeper correction. The recent trend is bullish and it is a buy on dips but this pair has become more sensitive to risk appetite lately. I am waiting to buy on dips.
USDCHF – Reverse of EURUSD. Moving averages have bunched up and this has found support off a rising trendline and 1.05 SR level. I favour the upside and I am a buyer of dips but like the Euro we could be in for a volatile week.
Crosses:
AUDJPY – Small weekly hanging man doji, daily consolidating sideways after breaking out and making new highs, a possible bull flag forming. I like this counter-trend short at this point as it needs to correct to get me long. Possible megaphone top forming. and weekly warns of a possible turn here.
NZDJPY – Weekly is an inside bar, daily is bullish but failed to break the high of last weeks bullish engulfing candle. This pair is forming a large triangle with support at 6490 and resistance at 6700-6750 and price is testing the top of the triangle. I prefer this to the short side but there is no price action to short so I am sitting out and waiting for a breakout or price action to short.

weekly inside bar, daily is a bullflag consolidation after this pair broke out of its long term range and highest level since October 08 and it looks all set to climb to 95.50. This is a buy on dips for me but no entry at this level, it needs to pullback to get me long or break out of the flag and there is no price action to short. I would look for a pullback to 88.50 to buy. Previous resistance could become support at 90.60.
AUDNZD – long uptrend – This pair is pulling back after a big breakout and I would be looking to buy in the 129.50 area but this is not a pair I like – pass

Strong downtrend, this pair made new lows again this week but a possible upwards correction is underway with Greek euphoria. I would sell a retest of the 1.90 SR level and previous trendline support. Only a break above 1.9240 changes my bearish view.

Weekly and daily consolidating sideways in a wedge after strong longterm downtrend. I can’t decide if this pair is putting in a bottom or if this is a bear flag and only a breakout will tell. I am on the sidelines until then.

Weekly bullish engulfing, daily bullish and still in a very tight triangle but may be breaking to the upside. I thought this had broken out to the downside but it failed to break the December lows and pulled back up. I am waiting out for clearer direction here but this wedge shape is bullish.

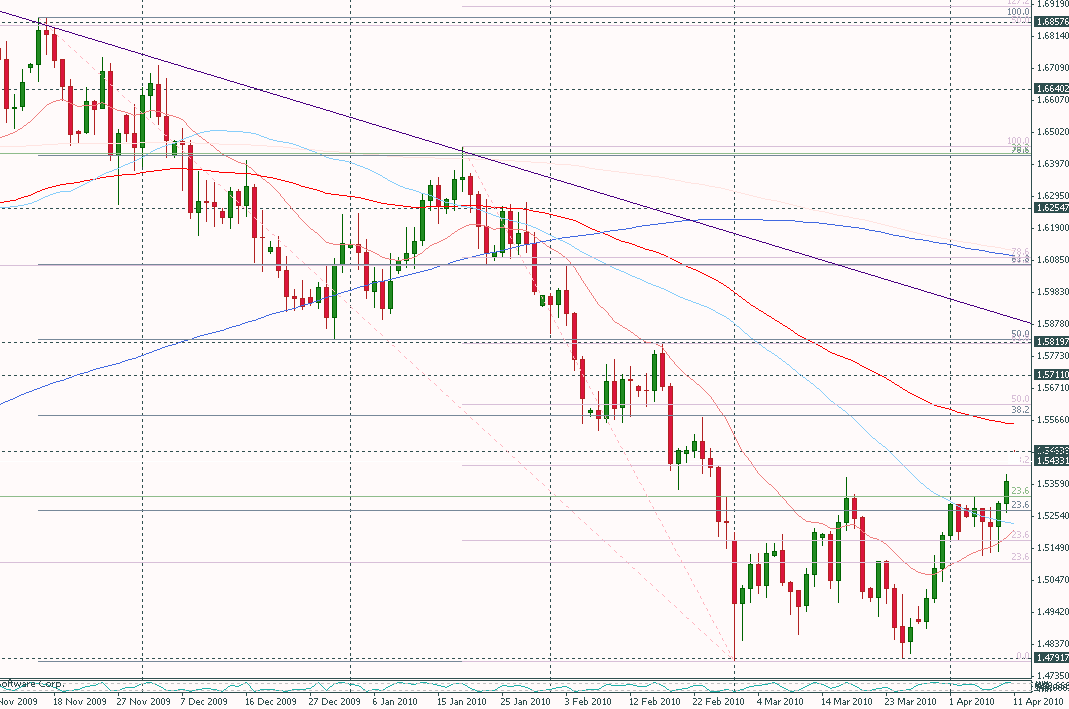
Very strong downtrend, this is a one-way train. Greek news might give us a pullback to sell this but the next support is really at 1.4010. I would sell a retest of 1.50 or 1.5475 area if it got that high. Pass until this gives us an entry.

Weekly inside bar following bullish breakout, daily consolidating in what could be a bull flag. Holding above the trend-line this is a buy on dips and my target is 146.75-147.30 then possible 151.60 and long term trend-line resistance. Only back below 141.50 would mean a bearish false breakout. I am counter trend short but looking for price action to reverse.

Weekly and daily shooting star reversal off previous trendline resistance and the 1.63 SR level, I like this short for the downtrend to resume and this is a great sell for me.

Bearish weekly and daily but at the bottom of a long term wedge. With the Greek rescue I like this long a lot. Buy the weekly hammer.

Weekly bullish piercing line, daily bullish continuation of a hammer. Higher highs and lows say uptrend underway and I would buy dips with a target of 129 and the descending trendline where I would be looking to sell again.
EURCHF – Weekly and daily bullish correction underway A countertrend long on Greek euphoria is tempting or will wait for price action to short at 1.4438

Weekly bearish in an ascending channel. I would look to buy the bottom and sell the top of this channel until price breaks out. If the dollar does continue its bearish correction this might drop out of the bottom and be a good short trade targeting the lows.

Weekly bear flag, daily head and shoulders, this has broken out to the downside and is a sell on rallies or a retest of the trendline support from the underside.
-----------------------------------------------


Fantastic analysis Nic!!
ReplyDeleteThat's the reason I am fan of your blog!
I don't know how you keep tab of all these pairs. I can hardly focus on 4-5.
Looking to buy cad,aussie and pound on dips now. t
Good luck to us.