Thursday, May 13, 2010

Thursday 13 May

I am late today because I am a bit busy with things this week outside of trading.  
I am short a few sterling crosses because sterling usually drops the month following an election.  I particularly like GBPJPY but it will not do well in US sessions if stocks rally.
However a lot of XXXJPY crosses have broken out of wedges this morning, and I have liked the yen crosses lower for some time.
GBPJPY 240min chart


AUDCAD has broken out of the range I had been waiting for.  It looks good counter-trend long to retest the breakout level here but I am going to wait and sell a retest rally.

GBPJPY short 137.80 stop 138.30 - addition
GBPAUD closed 50% @3R 1.6510 (+1.5R)
CRUDE long stopped out (-1R)
BRENT crude short 80.75 stop 81.25
GBPJPY closed 50% @3R 136.30  (+1.5R)
SILVER stopped out (-1R) - will try this one again
GBPAUD short balance closed 1.6250 (+4.1)
GBPAUD long 1.6250 stop 1.6190 PT 1.6450 / 1.6550
SILVER short again 19.630 stop 19.820 PT 18.65
BRENT closed 80.50 (+0.5R) - trade not working
CRUDE long 74.50 stop 73.90  PT 76.00 / 78.00
GBPJPY short (today) closed 1.3580 (+2)
GBPJPY original short 1/4 balance closed 1.3580 (+2.55)
GBPJPY long 1.36 stop 1.3550 PT 1.3750 / 139.00
GBPUSD long 1.4680 stop 1.4630 PT 1.4950
CRUDE long closed 50% @ 76.30 (+1.5)
CRUDE closed balance 75.00 - price action too confusing (+0.4)
EURNZD long 1.7525 stop 1.7475 PT 1.7675 countertrend
GBPUSD long stopped out (-1R)
GBPJPY long stopped out (-1R)

Open trades:
EURUSD short 1.3110 stop 1.3135 PT 1.23 - 1/4
USDJPY short 93.75 stop 94 - 1/4
GBPAUD long 1.6250 stop 1.6190 PT 1.6450 / 1.6550
SILVER short  19.630 stop 19.820 PT 18.65
EURNZD long 1.7525 stop 1.7475 PT 1.767

Wednesday, May 12, 2010

Wednesday 12 May 2010, Silver

Nervous markets continue ... UK GDP numbers this morning are the big mover for sterling shortly in a low news day.  I have noticed since the crash I have not seen one Greek riot shot on CNBS :)
The Euro is starting to look very weak.  EURCHF is 40 pips above all time lows and if EURUSD breaks last weeks spike low we could see a sharp further fall.  Yen crosses are struggling to gain back last weeks falls and tripping at key fibonacci levels.
If / when stocks fall off again I will be selling AUD or NZD.

I like the setup in GBPAUD for a short today if stocks rally and short USDCHF. I also think there is some value in a countertrend long in AUDUSD with an upside target around 91.50

PS - Be very careful.  If you only sell and don't buy the CFTC will investigate you for causing market crashes.

SILVER
I am looking at a the 19.51 area as a possible short for today or tomorrow.  (Fibonacci timing tool says tomorrow should be the top).
My reasons are:
1.  That would be a double top
2. That is where the swing equals the swing from the end of Jan to March (AB=CD)
3. That is the 1.618 fib extension of the swing from end of Jan to March
4.  Top of the channel resistance (3rd touch)
------------

UPDATE re CRUDE
The International Energy Agency today released its monthly report for crude demand and for the first time in a year it has reduced its forecast for crude.  Looking at the crude chart for the past week it makes you wonder how many people had advance warning of this report, especially as crude hasn't even sold off on the news.
Inventories this morning might perhaps get this market moving.
------------

CRUDE 3rd addition closed 50% @3R 75.80 (+1.5R)
CRUDE 3rd addition stopped out balance @76.60 (+0.5R)
SILVER short 19.560 stop 19.750 PT 18.650 / 18.00
GBPAUD short 1.6660 stop 1.6710 PT 1.6500 / 1.6380
CRUDE short 76.40 stop 76.80 PT 75.50
CRUDE short stopped out (-1R)
CRUDE short again 76.20 stop 76.60 PT 75.00
AUDJPY short 83.10 stop 83.50 PT 81.00 (gap fill from Sunday)
CRUDE short closed 50% @3R 75.20 (+1.5R)
AUDJPY stopped out (-1R)
CRUDE today short balance closed 75.50 (+1.1R)
CRUDE short 25% balance from 79.70 closed @ 75.50 (+2.1R)
CRUDE short 25% balance from 86.75 closed @ 75.50 (+7R)
CRUDE long 75.40 stop 74.90 PT 78.50 / 82.00

Open trades:
EURUSD short 1.3110 stop 1.3135 PT 1.30 - 1/4
USDJPY short 93.75 stop 94 - 1/4
GBPJPY short 140.90 stop 141.40 - 1/4
SILVER short 19.560 stop 19.750 PT 18.650 / 18.00
GBPAUD short 1.6660 stop 1.6710 PT 1.6500 / 1.6380
CRUDE long 75.40 stop 74.90 PT 78.50 / 82.00


Dow 1929 and now - video

Here is an excellent video from Jamie Saettele at DailyFX, author of  Sentiment in the Forex Market

Technical Implications from Last Week’s Equity Plunge


There have been just 2 instances in the history of the US stock market (as measured by the DJIA) when a 10% intraweek decline followed a top that was preceded by a 52 week rate of change of at least 50%. Those 2 occurrences were the weeks that ended October 25th 1929 and last week. The former is the week prior to what is referred to as Black Monday (10/28/29) and the stock market crash of 1929.
*I understand that last week’s decline is being blamed on a number of factors, ranging from algorithmic trading to someone hitting a B instead of an M (billion as opposed to million). There is always a ‘reason’ that something might have happened. In 1929, margin accounts were blamed…in 1987, program trading was blamed. Bottom line; it happened. More importantly, it happened after a rally that reversed at the 61.8% retracement .
In both instances, the actual highs occur 8 weeks after their 52 week rate of change extremes (67% in 1929 and 59% in 2010). The 1929 decline occurred following a new all-time high while the 2010 decline occurred following a retracement (of 61.8%) of the decline from the 2007 high. Either way, the implications are that last week’s wild ride is the beginning rather than the end of a larger decline….and perhaps even a crash.


Tuesday, May 11, 2010

Floored the movie

Floored Part 1

Floored Part 2

Floored Part 3

Floored Part 4

Floored Part 5

Floored part 6

Tuesday 11 May

The S+P has retraced to the 61.8fib retracement of the flash crash and is sitting on the long term daily trendline from the March lows.  A key inflection point and where we go from here might determine what the market does for the next few weeks.  A rally from here would likely see news highs and a break lower sends us to retest the lows.
The FTSE Futures shows how these previous support turned resistance are holding across the board.

In FX the market feels heavy.  The EU's bazooka or "debt baguette" seems like an invitation to me to all the EU banks to try and dump their toxic Sovereign paper and ZH reports European Banks now feverishly betting against Euro.  My new target for EURUSD is 113.  BUT this is a very one-sided trade and short sharp squeezes are likely.

Sterling is heavy with the election still unresolved and the possibility of a LIB/LAB pact and talk of ratings agency downgrades with the uncertainty.  Not even good manufacturing data could lift it this morning.  Cable has bounced at a retest of the trendline and is a pretty safe bet to retest the lows now.  My only worry is now MS likes it short too!
GBJPY also retested old daily trendline and 61.8fib and has been rehjected.

All the JPY crosses look weak and Yen looks strong as USDJPY has been rejected at the 93 level and previous trendline support.


If stocks do indeed break lower today I will be looking to short AUDUSD which has struggled to get back above the 9000 level.

USDCAD also is a good looking long opportunity
if it successfully holds above the previous trendline resistance and at least we know where to put the stop.


CRUDE is extraordinary.
 I have never seen such a big drop in crude without a bounce.  We now hover just above the 75.00 level and I would not be surprised to see this broken and then a retrace higher.  I think some longs may be getting pretty squeezed down here.  When we bounce we could go all the way back to 82 and I still keep my bearish view and sell rallies but for now 78 is pretty strong resistance.

GOLD is a one way ticket north.  I missed it and I have been reluctant to chase it at these prices but while the mood continues today may be the day we see new highs in Gold.  The broadening wedge in Silver continues and I am watching for a test of the top and the 19.00 level.

Time to wait for the US to open and see how risk appetites does today but the bullish chatter in my twitter stream has quietened down a lot .... actually that might be a buy signal ;)

A quiet day here
GBPJPY short addition closed 25% @6R 137.80 (+1.5R)
USDJPY short addition closed 50% @3R 92.55 (+1.5R)
GBPJPY short addition 25% balance stopped out 139.40 (+0.5R)
USDJPY short addition 50% balance stopped out 93.05 (+0.5R)
CRUDE third addition 50% balance stopped out 77.20 (+0.5R)
CRUDE short 77.00 stop 77.40 PT 75.00  - try again

Open trades:
CRUDE short 86.75 stop 87.15 + 79.70 stop 80.20 - both 1/4
EURUSD short 1.3110 stop 1.3135 PT 1.30 - 1/4
USDJPY short 93.75 stop 94 - 1/4
GBPJPY short 140.90 stop 141.40 - 1/4
CRUDE short 77.00 stop 77.40 PT 75.00

Monday, May 10, 2010

Monday 10 May

I still have small parts of positions running from last week but I am mostly watching to see how everything shakes out after last weeks big moves.  This morning I am watching for short opportunities on the JPY crosses and perhaps a countertrend long in crude in the US session.

AUDUSD balance stopped out 0.9020 (+0.25R)
AUDJPY balance stopped out 85.05 (+0.25R)
USDJPY short 93.30 stop 93.55 - addition
GBPJPY short 140.20 stop 140.60 - addition
CRUDE short 77.70 stop 78.20 - addition - gap fill I hope
EURUSD short 128.75 stop 129.25 - addition, gap fill
EURUSD short addition closed 127.65 gap filled (+2.2R)
CRUDE closed 50% @3R 76.20 (+1.5R)
GBPJPY short addition closed 50% @3R 138.70 (+1.5R)

Open trades:
CRUDE short 86.75 stop 87.15 + 79.70 stop 80.20 - both 1/4
CRUDE short 77.70 stop 78.20 - 1/2
EURUSD short 1.3110 stop 1.3135 PT 1.30 - 1/4
USDJPY short 93.75 stop 94 - 1/4
USDJPY short 93.30 stop 93.55 
GBPJPY short 140.90 stop 141.40 - 1/4
GBPJPY short 140.20 stop 140.60 - 1/2

Sunday Analysis, 9 May

Extreme Volatility!  The kind of price action following last weeks moves might be difficult for swing traders and favour day traders.  Patience and discipline required :)  with weekly candles and trading ranges not seen since the Lehman aftermath.  Forget fat fingers and computer meltdowns.  The computers switched off, the market reverted to people and the people panicked.  
Prior to the drop of last week the stock markets were extremely bullish and I expect a volatile week and a substantial rebound however the speed at which the market panics and becomes bearish is not good for bears as sentiment needs to stay somewhat bullish for this down-leg to continue.  It really bothers me we have not dinged the 61.8fib retracement in the S+P.  I would not be surprised to see a new high to touch that big level before the downward correction continues again.  In the meantime we have a wide trading range in which we could be chopped to death by a thousand cuts if we are not careful.

The EU have announced their market calming package and it it certainly bigger than I was expecting, it is almost a trillion dollars but it still has to pass at national government levels.    The package also indicates they will intervene in the debt markets.  The market is massively short EUR so even if the package is less than inspiring the EUR is going to be prone to short sharp squeezes and looks set to make a corrective rally irrespective at this point.

Indices:

S&P futures: 
Weekly opening black Marabuzo that covers 8 prior weeks of gains, daily inside bar following Thursdays huge range.  The diamond top reversal of last week worked better than perfectly!  Despite the sharp rebound from the lows the close below the daily trend line support and 200 daily moving average indicates a trend change in the offing.  However because the 61.8fib from the big drop has not yet been touched I would not be surprised to see new highs in this index before we continue down again.  Technically the 1152.75 SR level and the underside of the weekly trend line from the lows looks like a good place to try a short and if that fails then 1188 would be my next area of interest.

The dow in its drop fell right onto the 61.8fib retracement level.  Very neat and a little clean ... hmm


FTSE futures
Weekly opening black marabuzo, daily inside bar following Thursdays wide range. Downtrend correction.   Friday price came up and tested the 200 daily moving average and bounced down again.  Obvious levels to watch for shorts are 5390 and 5562 but the upside could be capped at 5275 with no resolution to the election horsetrading.

GOLD
A bull market in full swing.  Weekly bullish continuation, daily doji made new highs following Thursdays long marabuzo. Price has paused at 161.8 fib extension of the last swing and has made two symmetrical swings to reach this high so I would expect a pullback here to the 1161.88 level  before continuing higher to test the previous highs.

SILVER  
Silver has a weekly hanging man doji (bearish) and despite a long bullish day Friday failed to close above the open for the week.  The daily shows an interesting broadening wedge pattern which clearly defines the ranges and possible entry short. 

CRUDE 
What a week, weekly bearish long marabuzo, daily inside bar following Thursdays steep drop only halted by the round number 75.00 level.  I know people who are bullish crude and who simply do not believe that crude has dropped 1200 in one week (and are in some pain).  The triple top of last week has produced a drop that has removed 10 weeks of gains (a drop not seen since Sep 08), price has closed below the trendline support from the March 09 lows and below the 200 day moving average for the first time.  Price has stopped smartly on the daily 50sma and the August 09 swing high, so I expect a good bounce here but the trend has clearly changed.  I am looking at a retest of 80.00 / 80.80 and the underside of the trendline or 81.30 / 82.00 as areas to add shorts and I would also add to shorts on a clean break of 75.00 but selling rallies is preferred and we could have a big bullish week after this drop.

Currencies


DOLLAR INDEX 
Dollar index is at the upper reaches of an ascending channel.  While the bull trend is intact a pullback is possible at this point of the 85.00 round number and fibonacci resistance.


AUDUSD
This chart has rolled over.  Weekly dark cloud cover potential reversal, engulfs multiple weeks of gains and has broken trendline resistance from the February 09 lows and 200 daily moving average.  I am a seller of rallies and I am looking at 91.30- 92.00 as a good area for price action to get short again targeting a break of 85.75 support.

EURUSD 
Going back on a long term chart for this pair, using data for the ECU that the Euro replaced you can see that 1.25 and 1.30 are important pivot levels for this pair and a bounce here would not be a surprise.  The market is very short EURUSD and even if the market ultimately does not like the rescue package or it is bearish for EURUSD, sharp short squeezes are inevitable when sentiment is so lopsided.  Added to this we have EURUSD on longterm trendline support which although penetrated, it has closed above.  This pair has hit my objective of 1.26 and so I will let the rally play out and look for price action at 1.3040-60 and 1.3120 to get short again.  Only a close above 1.36 changes my view with regard to the trend.

GBPUSD 
Weekly opening black marabuzo, daily inside bar following Thursdays long hammer on high volatility.  The trend is down and n this pair due to Thursdays election that still has not resulted in a majority Govt.  Although the trend is clearly down in this pair and it has broken long term daily trendline support it is clear a retrace is on the cards.  I am watching for 1.5125 + 1.5175 area to short this pair but it has to clear the resistance at 1.4840-1.4950 where we could bounce back to the lows.
.  
NZDUSD
NZD is the strongest currency after the USD and JPY so the best countertrend long and the least rewarding short.  Weekly is a doji (almost a hanging man but with a bigger body) and daily is an inside bar following Thursdays long marabuzo.  This pair briefly popped out of the bottom of the ascending channel but back in now and all set to retest the highs.  I would sell rallies, but this is not the most rewarding pair.  Pass.

USDCAD 
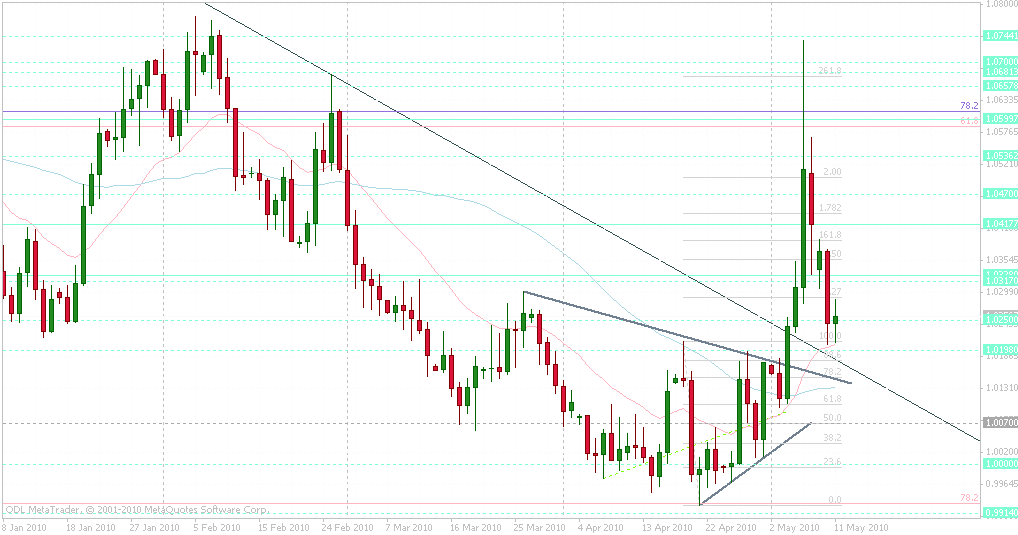
Weekly bullish marabuzo with long upper tail, daily inside bar following Thursdays huge rally.  This pair has broken long-term trendline resistance and hit my target of 1.07.  I would buy dips.  I am looking at 1.02 but I would not rule out a retest of 1.00 

USDCHF
Weekly bullish marabuzo, daily inside bar following Thursdays big rally.  I am a buyer of dips, I am looking at support at the bottom of the channel 1.0650/1.07 for longs.

USDJPY 
The market was very long USDJPY and got sqeezed badly when it failed at the 95.00 SR level.
The weekly drop erased two months of gains and no doubt a lot of longs had their stops eaten before a sharp bounce off the lows.  I favour more downside for this pair and I am watching for a retest of the short term trendline at 93.00/ 93.50

Saturday, May 8, 2010

Weekend Entertainment

Hat Tip to the TheReformedBroker blog
Why you should not do a webinar for paying clients during a stock market crash (erm because you sound like a raving lunatic)


Update:
I have T-shirts available, e-mail me :)

Friday, May 7, 2010

NFP Friday

It's NFP day and it might all be a let down after yesterday's history making day.  The biggest intra-day drop in US stocks and historical drops in yen crosses (at the height of the market’s fear-driven run CADJPY plunged 9.6 percent, AUDJPY dropped 9.4 percent, GBPJPY tumbled 8.2 percent and even USDJPY fell 5.9 percent) and it was all over within an hour.


I lay awake last night thinking about this for ages.  If you look at a chart of the January 9% correction (also right after earnings) it took a couple of weeks to play out and most bears were able to participate and profit.  Yesterdays drop of a similar magnitude took place in a couple of 5 minute candles, almost as though all the big players decided to pull the bid simultaneously, and then we bounced off the lows very hard and very fast.  Never mind good luck getting filled, most people I know couldn't not even get in to their brokers platforms.  And then last night the US Senate votes to reject the Brown/Kaufman bill to limit the size of Banks to 2% of GDP.  Is that a coincidence?  I am struggling to believe it is.  It is almost as though they wanted to scare the senate but didn't actually want anyone to participate or profit in the moves.
I realise this makes me sound like a bit of a tin-hatter but this market correction has been on the cards for some time.  The stock market has moved higher and higher in a bearish rising wedge held up by huge taxpayer cash injections and no volume.    There are lots of things being blamed, The ECB fiddling while Rome is burning in Europe, The mining disaster followed by the Gulf oil spill hitting energy and commodities hard, China tightening, etc..  There isn't a technical analyst on the planet that didn't predict this correction but to have it all done in an hour where if you took too long for lunch or went to the bathroom you missed it?
Now we have a wide trading range to back and fill for the next couple of weeks while the market sorts out what is what.  I would expect that we retest these lows at some point but we could be bouncing around for a while and also do some retracing.


Last night the BOJ intervened for first time since Dec, injecting 2 trillion yen to weaken their currency. 


Cable has dropped 300 points in the hour before the open on news of a hung parliament and Soveriegn CDS are widening again, UK CDS are 16bps wider at 102 bp, a record.  This is sterling negative.  European bourses that missed the afternoon fun are about to open.  Normally markets would be quiet running in to NFP but this is not a normal NFP day.  NFP forecast is for +190,000 jobs and no change to the jobless rate at 9.7%.


CRUDE 
Has broken trendline support from the lows of 2009 and is sitting on the daily 200 moving average and the 61.8fib retracement of the recent Feb low / April high swing,  which is support for now.  I expect a good retracement before more downside but that might be a move for next week and I am looking at 81.00 or 82.20 as levels to reload shorts.
Here is Phil's crude chart with TL support and a large bearish rising wedge 


EURUSD
Continues to sit on the big daily trendline I pointed out yesterday.  A massive double no touch option is rumoured to be at 1.25 / 1.35 which would explain why EURUSD did not participate in yesterday's big drop (that must have cost someone a lot of money).   I would sell a retest of 1.30 or 1.3120


AUDUSD / AUDJPY
These are the hot risk meter charts ... although CADJPY was the biggest loser in yesterdays moves.


USDJPY
Below the short term trendline and 92.50 I like this short and I am a seller of rallies.  If 92.50 does not hold I would sell 93.50 and a test out of the breakout level.


EURCHF balance 25% stopped out 1.4145 (+0.5R)
GBPJPY short 1.35 stop 1.3550 PT 1.32 
CABLE short 1.4650 stop 1.4710 PT 1.4350 - post election
GBPAUD short 1.6440 stop 1.6490, PT 1.61 break of daily TL
GBPJPY short addition stopped out (-1R)
GBPAUD short closed 1.6470 (-0.4R)
CABLE short closed 1.4680 (-0.5R)
4hr hammers forming everywhere on sterling thanks to Moodys for saying hung parliament no threat to AAA
GBPJPY short 135.30 stop 136.10 PT 130
GBPJPY short addition closed 1.3450 - stocks rallying hard - (+1R)
EURGBP balance stopped out 86.25 (+0.5R)

Open trades:
CRUDE short 86.75 stop 87.15 + 79.70 stop 80.20 - both 1/4
EURUSD short 1.3110 stop 1.3135 PT 1.30 - 1/4
EURGBP short 0.8650 stop 0.8675 PT 0.8446 - 1/2
USDJPY short 93.75 stop 94 - 1/4
AUDJPY short 84.65 stop 85.05 - 1/4
AUDUSD short 0.9035 stop 0.9050 - 1/4
GBPJPY short 140.90 stop 141.40 - 1/4

Thursday, May 6, 2010

BLACK THURSDAY

It is election day in the UK and ECB rate decision day so all eyes on Europe.

The SnB has finally pulled their bid on EURCHF after good CPI numbers and apparently spending around 20bln in the last week.  EURCHF fell 120pips in a few minutes and we have a new line in the sand at 1.4210

EURUSD
EURUSD is sitting on 5year trendline support at 1.2730/1.2750 and there has been speculation that Trichet may announce some more QE this morning (agreeing to accept any quality Greek paper is already QE). In normal times this might be seen as very EUR negative but with the events of the past month this might be seen as more vigorous action and EUR positive.  If the trendline support goes then next support is not really until 1.2330 and the 2007 lows.

Price action is still really volatile and yen crosses look weak after USDJPY failed on the first attempt at 0.95

I was looking for an election rally in Cable to sell, looking for a target of 1.4780 2010 lows to be retested.

CABLE long stopped out (-1R)
USDNOK short stopped out (-1R)
EURCHF short 1.4205 stop 1.4235, 1hr inside bar, PT TBD
EURGBP short 0.8475 stop 0.8490 PT 0.8320
EURCHF closed 50% @ 3R 1.4115 (+1.5R)
AUDJPY short 84.65 stop 85.05 PT 82 / 80.50
CRUDE short 79.70 stop 80.20 PT 76.50 / 73.60
AUDUSD short 0.9035 stop 0.9050 PT 0.8895 / 0.8760
GBPJPY short 140.90 stop 141.40 PT 138.75 / 137
EURGBP addition stopped out (-1R)
USDJPY short closed 50% @3R 93.00 (+1.5R)
GBPJPY short closed 50% @3R 139.40 (+1.5R)
AUDJPY short closed 50% @3R 83.45 (+1.5R)
AUDUSD short closed 50% @3R 89.90 (+1.5R)
CRUDE short closed 50% @3R 78.20 (+1.5R)
USDJPY short closed 25% @ 89.75 (+4R)
GBPJPY short closed 25% @ 131.00 (+4.95R)
AUDJPY short closed 25% @ 78.00 (+4.15R)
AUDUSD short closed 25% @ 87.50 (+4.75R)
CRUDE short closed 25% @ 75.00 (+2.35R)
EURCHF closed 25% @ 6R 1.4025 (+1.5R)

Open trades:
CRUDE short 86.75 stop 87.15  & 79.70 stop 80.20 - both 1/4
EURUSD short 1.3110 stop 1.3135 PT 1.30 - 1/4
EURGBP short 0.8650 stop 0.8675 PT 0.8446 - 1/2
USDJPY short 93.75 stop 94 - 1/4
EURCHF short 1.4205 stop 1.4235 - 1/4
AUDJPY short 84.65 stop 85.05 - 1/4
AUDUSD short 0.9035 stop 0.9050 - 1/4
GBPJPY short 140.90 stop 141.40 - 1/4


Wednesday, May 5, 2010

Wednesday 05 May 2010

This market got very bearish very fast ...
The dollar index at 83.72 is the 61.8fib of the big drop (March to November 09) were I might expect a wobble and there is also some previous support at that level.
Crude oil is at daily trendline support, EURUSD is at the 161.8 fib extension of the last swing, the SPX has stopped at the 1.27fib of the last swing, AUDJPY did not break the daily trendline support, etc.  So while it looks like key trendlines have been broken we could have a bump in the road ahead.
I am a dollar bull and this isn't a trend change, just a bump ahead perhaps.
.... and I am often wrong :) 

Dollar Index daily chart:


Yields are blowing out on euro bonds this morning, usually signifies more EUR losses


CRUDE short 82.00 stop 82.50 - 1hr flag - PT 81.20 / 79.60
GBPJPY closed 143.19 - not working (+1.1R)
AUDJPY closed BE
AUDUSD short 90.65 stop 90.85 - 1hr bear flag
EURUSD short 1.2920 stop 1.2945 - 1hr bear flag
CRUDE addition closed 79.60 target (+2.8R)
GBPJPY long 1.42 stop 141.65 PT 143.20
USDCAD closed balance 1.0300 (+1.9R) - market reversing 
EURUSD addition closed 1.2860 (+2.4R)
AUDUSD closed 0.9068 (-0.15R) market reversing
USDNOK short 6.0700 stop 6.1000 PT 5.9250 / 5.900 *
GBPJPY stopped out - ouch (-1R)
Asian session:
GBPUSD long 1.51 stop 1.5050 PT 1.5290 
I am looking for election euphoria pullback in sterling to short again
USDJPY short 93.75 stop 94 PT 92.90

Open trades:
CRUDE short 86.75 stop 87.15  PT 84 - 1/4
EURUSD short 1.3110 stop 1.3135 PT 1.30 - 1/4
EURGBP short 0.8650 stop 0.8675 PT 0.8446 - 1/2
USDNOK short 6.0700 stop 6.1000 PT 5.9250 / 5.900 *
GBPUSD long 1.51 stop 1.5050 PT 1.5290
USDJPY short 93.75 stop 94 PT 92.90

* Norges Bank hiked rates this morning

Tuesday, May 4, 2010

Tuesday 4th May - Turnaround Tuesday?

A wind storm and technology failure let me down this morning.  Time to catch up.

An unexpectedly dovish RBA statement last night has sunk the Aussie to support at 91.70. Down moves in April have had almost no follow through so we will see if this one has any legs. EURUSD is back at 2010 lows / support just above 1.31 on news Greece has hired a restructing firm (possible default?) and that the 110 billion bailout package will likely not be enough money.
Sterling has taken another hit but nothing has broken out of it's ranges yet, much like the indices.
USDJPY has pulled back to test last weeks high but looks set to pullback further.
Crude is off 2.50 from the highs, Gold has caught a bid but stuck again at the 78.2 fib.
I would not be buying EUR at this level, this is a one-way train for now.  A break of these lows could see some significant stops below and I am going short a break of 1.31 level.
I still like the XXXJPY's short but they will struggle if the US indices rally as usual.  Other than that I am struggling to see a trade I am really excited about, but when I do I will post it.

GBPAUD balance stopped out 1.6550 (+0.5R)
EURUSD short 1.3110 stop 1.3135 PT 1.30
CRUDE closed 50% @84.00 target (+3.4R)
USDCAD long 1.01850 stop 1.01550 PT 1.0275 / 1.039
EURUSD closed 50% @3R 1.3035 (+1.5R)
CRUDE closed 25% @83.00 (+2.3R)
GBPJPY long 142.75 stop 1.4235 PT 144.50 countertrend
EURGBP short 0.8650 stop 0.8675 trendline break PT 84.60
CRUDE short 83.00 stop 83.45 PT 81.65 (hourly inside bar)
CRUDE addition closed 82.60 (+1.3R) - end of day.
AUDJPY long 85.80 stop 85.60 PT 87 off daily TL support
EURUSD short closed 25% @1.2965 - 1.618 fib (+1.45R)
EURGBP closed 50% @3R 85.75 (+1.5R)
USDCAD closed 50% @3R 1.0275 (+1.5R)


Open trades:
CRUDE short 86.75 stop 87.15  PT 84 - 1/4
EURUSD short 1.3110 stop 1.3135 PT 1.30 - 1/4
USDCAD long 1.01850 stop 1.01550 PT 1.0275 / 1.039 - 1/2
EURGBP short 0.8650 stop 0.8675 PT 0.8446 - 1/2
GBPJPY long 142.75 stop 1.4235 PT 144.50
AUDJPY long 85.80 stop 85.60 PT 87

Chart of the day:
AUDUSD weekly - trendline support has broken today.  If we close the end of the week below here then things get interesting, when this happened in January there was good follow through.


USDCAD has done the same.
Weekly trendline resistance is broken.   These are my "canary in the coal mine" pairs for trend change.

Monday, May 3, 2010

Monday 02 May

EUR and sterling got spanked overnight as the market was unimpressed with the Greek bailout announcement which still requires the support of all EU members and UK election news that the odds of a hung parliament are increasing.
The ECB has suspended the minimum credit rating collateral rules for Greek bonds so all Greek paper is eligible until further notice in an attempt to stop the bleeding.
EURUSD is back at the old trend-line support and 61.8 fib retracement of the rally from last weeks lows so it could catch a bounce up here as Europe comes in.
London is closed so I am going to leave it and come back for the US open.

EURJPY closed 124.70 (+1R)
GBPJPY closed 143.70 (+2R)
CRUDE short 85.90 stop 86.30 PT 84
CRUDE stopped out (-1R) stop too tight
EURUSD short 1.32 stop 1.3230 break of overnight support TP 1.31
EURUSD closed 1.3180 - trade not working (+0.6R)
CRUDE short 86.75 stop 87.15  PT 84
GBPJPY short 143.70 stop144.60 PT 142 - 4hr inside bar
EURJPY short 124.75 stop 125.10 PT 123.20
EURJPY stopped out (-1R)
GBPJPY stopped out (-1R)

Open trades:
GBPAUD short 1.66 stop 1.6650 PT 1.6250 - 1/2
CRUDE short 86.75 stop 87.15  PT 84

Currencies - Majors

Greece is not a done deal and the market knows it.  No bounce for EUR (yet).

AUDUSD
Weekly long legged doji, daily inside bar.  After breaking out of a broadening descending wedge AUD was unable to make new highs above 94 and there is the potential for a double top in this pair.  However the tight flag pattern AUD is making above the old trendline and the inability of the bears to push price back below it is bullish.  I favour shorts below the short term trendline but there is the possibility of a long breakout on this pair and new highs.  As the most risk sensitive pair much will depend on the direction of the indices for AUD.  Pass for now, wait for a break out or break down.

EURUSD
EURUSD is at a big crossroad of long term trendlines as the expanded weekly chart below shows.
Weekly bullish hammer, daily bearish. 
I am writing this Sunday night and already tonight price has formed a bearish engulfing before Europe is even awake.  The bailout bounce has not happened and the strong downtrend continues.  However there is short term trendline support at 1.32 and I would not be surprised to see a bounce here.  I am sitting out and will sell rallies, I am looking for 1.34-1.3430 which is the top of the descending channel.  However the market is heavily short EURUSD and if there is a squeeze above that level then I would look for price action around 1.3580-1.36
Support is at 1.3115 the 2010 low this far but my targets are 1.30 / 1.23

GBPUSD
Weekly high wave doji, daily inside bar, high volatility.  Cable has spent the last month trapped in a range unable to close below 1.5150 or above 1.55.  I have been waiting for a run up to 1.57 for price action to short but with the election on Thursday time is running out.  I expect cable to remain supported but volatile into the election and perhaps a sell off afterwards if the results are not what Mr Market is hoping for.

NZDUSD
Weekly bullish thrusting, daily shooting star at the top of rising channel.  This looks like a great opportunity for a countertrend short at the top of the channel and price has made three equal thrusts up this swing (three drives pattern) so it is an interesting countertrend short.  However NZD is the strongest of the major currencies and this trade needs the indices to continue to sell of hard to work.

USDCAD
Weekly inside bar, daily bullish but price is consolidating in a wedge pattern on the parity mark.  The trend is clearly down but above parity I favour this long looking for a breakout of the wedge for a long, first target 1.017 the 1.06.  A break down of the wedge and below 1.00 first target is 0.99

USDCHF
Weekly shooting star off 1.089 resistance, daily bearish continuation.  Although USDCHF looks to have broken short term trendline resistance this pair looks bearish and a potential double top forming.  I favour this short below this level looking for a pullback to buy with the trend at 1.0650 and take another run at the resistance.

USDJPY
Weekly hanging man doji, daily shooting star.  The CoT reports show the market is quite heavily long this pair, although that eased off a bit this week.  I am waiting for this pair to pullback to buy and I am not tempted to short this countertrend.  US treasury yields came off quite a bit last week but USDJPY stayed supported.  I am looking for it to catch up and pullback and I am watching for 91.80 / 90.75 level

Indices Crude Gold Silver USD

US Indices have all bounced off the weekly 50SMA's which have provided chop zones in the past.
The S&P is starting to look toppy the way it did in January before it corrected 9%.  While the price action on Friday and the close was bearish it did not take out Tuesday low and stalled at the 78.2 retracement of the mid-week upswing.  I doubt we would continue straight down from here and we have Friday's NFP to get through which is predicted to be good (aren't they all, but they aren't).  The US indices are being strongly affected by the Goldman news flow and less so by the Euro/Greek crisis.


S&P monthly and weekly chart.
As CV pointed out to me the montly likes the 144sma and has hit it and closed below.  This moving average has proved strong SR in the past.
Shorter term
There appears to be a diamond top reversal forming on the 240min S+P chart.  This formation is rare but is very reliable (take a look at the big one on cable last summer).  If the pattern plays out then we go up from here to around 1202-1204 and I would look to sell rallies

FTSE
Weekly bearish engulfing, daily bearish engulfing, a clear top has formed.  After such strong downmoves last week I would not be surprised to see some bounce here, there is support at 5390 and 5275.  I am a seller of rallies.

GOLD
Longer term I am bullish with a target of 1206.  Price has bounced off the 1.27 fib extension of the last swing so we should pullback to 1169.70 or 1160 where I would be looking for price action to buy.  Pass for now, wait to buy.

SILVER
Weekly hanging man doji, daily bullish continuation.  Price has bounced off 18.75 April 08 high and a possible correction here.  However the trend is bullish and if the USD pulls back this won't work.  Pass for now, wait for better price action.

CRUDE
Weekly hanging man doji, daily bullish however price has rejected at 87.00 which is the 1.27 extension of the last swing.  I like this short here (countertrend) target ting 81.00 area but possible support at 84 and 83.30.  A break above 87.00 means we go to 91.50 and the top of the ascending channel

DOLLAR INDEX
Dollar index formed a bearish hanging man doji followed by two bearish harami off the top of a gently rising wedge pattern.  I expect the dollar to decline to the bottom of the channel and as the rising wedge is a bearish  we could possibly see a break to the downside at some point.  Some dollar weakness ahead perhaps.

Sunday 02 May 2010

Just finishing analysis but in the meantime.
New trade short GBPAUD, I entered this as a gap trade but because of the trendline break I think this will keep going.  This trade works best when stocks are going up.  See Friday's blog post for the trendline I am referring to.

GBPAUD short 1.66 stop 1.6650 PT 1.6250 - trendline retest
CABLE short closed @ 1.5250 (+3.3R)
GBPJPY short closed 50% @2.9R 1.4305 (+1.45R)
USDCAD closed @ 1.017 (+4.4R)

Open trades:
GBPJPY short 144.50 stop 144.80 PT 142 - 1/2
EURJPY short 125.10 stop 12550 PT 122.30 / 120.50-80 
GBPAUD short 1.66 stop 1.6650 PT 1.6250