I am expecting risk to rally this week after last weeks pullback and the flat Friday into the G20. The slide in equities halted when the financial reform bill became a done deal, 2300 pages of new regulation that doesn't seem to address too big to fail, leverage, supervision, the ratings agencies or Fannie and Freddie.
Rien ne va plus.
Spookily at the request of the Chinese there was no mention of the Yuan in the G20 communique tonight.
"President Hu went so far as to ask that mild praise for Beijing’s recent decision to make the yuan slightly more flexible be removed from the final communiqué. And he made no mention of the issue in his broad-brush speech to fellow G20 leaders." Makes me think there will be no revaluation at all ...
Spreads on Greek bonds were really ugly last week which should have been more bearish for EUR but HSBC say it may have just been due to IBoxx changes
Difficult days will be end of month/quarter/half year on Wednesday where managers rebalancing could favour undervalued currencies over the star performers.
Friday is NFP
S&P
Weekly is a very bearish engulfing bar halted which found support at the 61.8 fib retracement of the rally from the lows and also the 01/02 June swing low. I have two scenarios for the S&P. Bigger picture and using measured moves I expect an upwards move equal to the one off the lows that takes the cash price to the 1158 level. But I can't ignore the weekly candle and that may mean we only rally to 1108 (61.8fib retracement of last weeks down move) and then rolls over and retests the 1040 lows.
We will find out when we hit 1108 but I am leaning towards the more bullish one because I think we may be in a rising channel which is much easier to see on the FTSE.
FTSE
I am bullish FTSE off the bottom of this channel as long as it holds but longer term bearish. The weekly candle is a big bearish engulfing and price appears to be setting up a big weekly bear flag pattern (downside target 4300) but I think we have one more run up before we go down but we may only make 5230 resistance instead of the top of the channel at 5380
The bearish correction in the dollar index continues and I am looking for it to reach the 0.618fib retracement at 83.35 and the long term descending resistance line. However a measured move equal to the one down from the highs would target 82.50 and previous SR level of the
GOLD
Weekly hanging man doji is a possible bearish reversal for Gold but it is hard to sell against such a strong uptrend when the pullbacks are so shallow. I am looking for the high to be retested or a daily reversal candle before I short based on the weekly candle. More likely is a measured move equal to the rally from 219 April to 15 May which has a target of 1290 area which is also the 1.27 fib extension target. If you are bullish you could look for a pullback to 1240 or 1250 SR level to get long.
CRUDE
Weekly is a perfect hanging man doji after a big rally on Friday on news of a storm in the Gulf of Mexico, now Hurricane Alex, which could be a bearish reversal and it is also the 618fib retracement of the big fall from the April highs. The hurricane and the falling dollar could keep a bid under Crude and makes me cautious and leaning towards bullish.
I like it short to start the week and then I would buy a pullback (77.00-77.50 maybe) with a target of 83
Major currencies
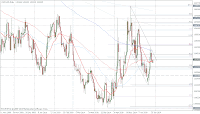
Weekly is an inside bar pullback and daily is bullish. This looks to be consolidating and not the best looking trade out there. I would buy a retest of 1.2330 or 1.2150 with a long target of 1.2650 initially. A break of the descending trendline sets up 1.30
GBPUSD
Weekly and daily bullish cable has closed above the 61.98fib retracement and above the 1.50 round number level. Still forming a big bearish gartley pattern on the daily cable is set to push higher first I would buy a successful retest of 1.5010 with a target of 1.5250 and possibly 1.5350. If 1.50 does not hold 1.4850 is next support for a long entry.
Weekly and daily bullish cable has closed above the 61.98fib retracement and above the 1.50 round number level. Still forming a big bearish gartley pattern on the daily cable is set to push higher first I would buy a successful retest of 1.5010 with a target of 1.5250 and possibly 1.5350. If 1.50 does not hold 1.4850 is next support for a long entry.
Bearish correction has stopped at 61.8 fib retracement and Feb swing high levels. I expect a bounce here, and I am looking for price action to sell again at 1.1230 or 1.14 to short.
USDJPY
Weekly and daily bearish but price now stopped at 89.00 and ascending trendline support and a pretty good pivot zone where bids usually appear. Longer term I am bearish USDJPY back to the 09 lows but I like USDJPY long above this trendline to 0.91. A break of 89.00 has an equal measured move target short of 88.10 and a retest of the flash crash low.
Weekly and daily bearish but price now stopped at 89.00 and ascending trendline support and a pretty good pivot zone where bids usually appear. Longer term I am bearish USDJPY back to the 09 lows but I like USDJPY long above this trendline to 0.91. A break of 89.00 has an equal measured move target short of 88.10 and a retest of the flash crash low.
AUDUSD
Weekly high wave doji, sideways consolidation. Like the S&P I am not sure of direction and neutral waiting for more information. The daily is a bearish Gartley but if stocks continue to rally the pattern will fail. I am watching for .087 to hold as support and if it breaks then price action at 0.8550 to buy. Below 0.85 and I am looking for a retest of the lows at 0.8070
Weekly high wave doji, sideways consolidation. Like the S&P I am not sure of direction and neutral waiting for more information. The daily is a bearish Gartley but if stocks continue to rally the pattern will fail. I am watching for .087 to hold as support and if it breaks then price action at 0.8550 to buy. Below 0.85 and I am looking for a retest of the lows at 0.8070
Weekly bullish engulfing, daily is bearish reversal off the top of a descending channel / weekly bull flag and 618 fib retracement. Daily could be forming an inverse head and shoulders. Like AUD the picture is not clear and we could have some more sideways consolidation but within the channel I favour more downside moves to 1.03 or 1.0220 and will look for price action there. A break of the channel to the upside means a test of 1.05 Until then I am waiting for more information.
Almost at the top of a clear descending channel I like this short below 0.72, first target 0.6580 support then 0.6260. A break of the channel to the upside has a target of 0.7630 high.
Bearish weekly engulfing candle, daily bearish but testing big weekly SR level at 0.8180
There is the potential for a bounce here with a potential double bottom on the daily and the upside target would be 0.8425 / 0.8550. A break and close below 0.8180 means next stop 80.25
There is the potential for a bounce here with a potential double bottom on the daily and the upside target would be 0.8425 / 0.8550. A break and close below 0.8180 means next stop 80.25
The 108.85 level is two equal measured moves down from the October 09 high and two consecutive daily dojis at the end of last week looks like EURJPY is trying to correct higher and could be a lower high. I like this long and a break of 113.40 and 114.0 then has a target of 116.80 and then 120.00
GBPJPY
After trading sideways for a couple of weeks this one is due for a breakout. I like this long and I would buy a dip to 1.32 or a break of the upper trendline and upside target is 139.25
AUDJPY
Bearish, AUDJPY has made two equal measured moves off the lows and the weekly candle is a bearish engulfing. I like this short initially with a downside target of 75.50 where I will be looking for price action to buy. Possible support at 76.80 and the flash crash low.
EURCHF
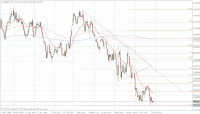
Bearish and ugly. There is a bearish bat pattern setting up on the weekly chart and I am looking for a drop from here to 1.32 area where there will be two equal measured moves down from 21 may high and it is the 61.8fib extension of the first swing. My bias is short to 1.32 and a buyer off that level.
GBPCHF weekly chart
I like this short! Triple top, descending trendline resistance from the 07 highs. Short targets 1.6090, 1.58
Monday trades:
CRUDE short 78.75 stop 79.05 PT 77.00
AUDUSD short 87.50 stop 87.70 PT 85.50
USDJPY long 89.40 stop 89.10 PT 90.30
NZDJPY short 63.25 stop 63.50 PT 62.60 / 61.80
USDJPY stopped out (-1R)
EURGBP short 81.75 stop 82.05 PT 80.25
AUDUSD short 87.50 stop 87.70 PT 85.50
USDJPY long 89.40 stop 89.10 PT 90.30
NZDJPY short 63.25 stop 63.50 PT 62.60 / 61.80
USDJPY stopped out (-1R)
EURGBP short 81.75 stop 82.05 PT 80.25


why 30pt stop?
ReplyDeleteis the james you refer to james16?
yes china just using words as smokescreen.
i got chopped in ej. not a great start. everything pointing long so will wait till 3-4pm now as this session is eeky.
They all happen to be 30 pip stops this morning, it normally varies.
ReplyDeleteNo James is Omni at T2W
These markets are sideways waiting for US ... I am the same
i think there is probably a good book in that potential setups thread.
ReplyDeleteHehe yeah. I learned a lot there, thank you Tom
ReplyDelete...The "Dumb Money" indicator... :)
ReplyDeletehttp://thetechnicaltakedotcom.blogspot.com/2010/06/investor-sentiment-story-continues.html
cool beans thanks
ReplyDeleteactually there seems loads of these smart money/ dumb money indicators.
ReplyDeletee.g
http://www.sentimentrader.com/subscriber/smart_money_index_description.htm
never tried any.