Otherwise pretty calm markets into todays FOMC. FOMC shouldn't matter as the Fed have promised to hold rates low until at least 2014 but market is still stalling.
Apple (AAPL) smashed earnings last night and twitter is full of the pundits (who were ALL bearish end of last week) now calling for $800 and $1000.
Bigger picture we are still in a bearish gartley pattern (see here chart from 7 weeks ago) but CL a better long set up than Brent. If this flag breaks to the upside and we close above 110 then upside targets are 116.50 & 121.60
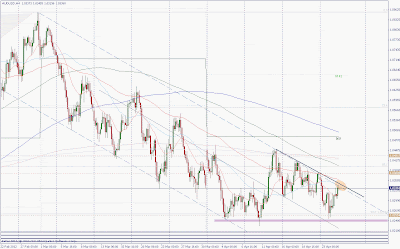
AUDUSD 4 hr chart. Similar setup, channel/wedge set for bullish breakout to the upside after triple bottom now on 50fib level
GBPJPY daily At resistance within a wedge (like everything else). Bigger picture is a bearish bat pattern
E-mini S&P June futures rangebound, approaching the top (again)
Today:
I should have sold cable on the GDP this morning but bottled out.
I will buy AUDUSD on a breakout of this channel.
EURUSD banked half 1.3212 +1.5R
Open positions:
EURUSD long 1.3152 stop 1.3132 target 1.33 - half position
EURAUD long 12672 stop 1.2638 target 1.3175 - half position
WTI June long 103.05 stop 102.75 ... open target - half position
Be lucky for FOMC :)


I am long Aussie already, but if it falls below 1.0305, i will close the position, lets see how FOMC will move the markets..3 minutes to go....still holding eurusd, euraud
ReplyDelete