Tuesday, August 10, 2010

FOMC - Correction time?

The market talk of QE has made it sound like a done deal and if the Fed disappoints tomorrow the US dollar could catch a big bid.  It looks like the market realises and the dollar buying looks to have started ahead of the announcement.
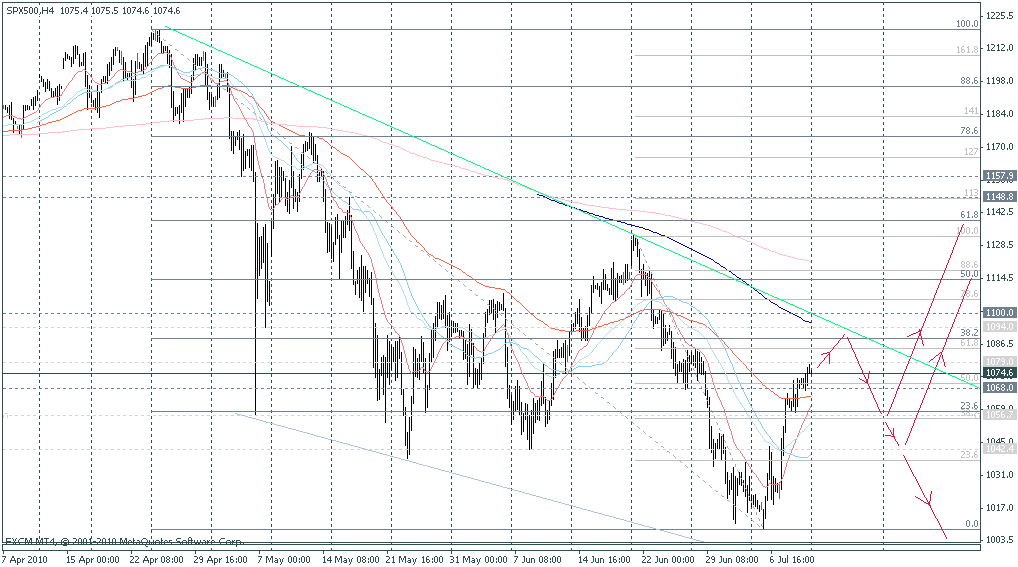
As I posted back in July the S&P was rejected at the 61.8fib level in April, retraced back to the 38.2fib and then bounced back  50fib level at 1121.44 which is where we are now.
People who study fibs say price oscillates in a channel at the 50fib area between 52.78% and 47.22%.  So for me .... a close above 1146.71 means we go (much) higher and a close below 1096.16 means we go much lower.  Simple right?  That is what I am watching for and until then we keep oscillating in the 50fib channel.


The dollar index support level in my previous post looks like it has caused a halt to the slide in the dollar for now.
The problem when a market is waiting for a big level to sell or buy is it gets front-run. The whole market is waiting for EURUSD to get to 1.35 to sell again but it looks tonight like it has fallen out of its rising channel and a bigger correction is underway.  The Euro is the only currency that has failed to get back above its 200day moving average vs the dollar which is interesting.
All the talk has been about more QE from the Fed in anticipation of tomorrows meeting and a lot has been priced in.  If there is no more QE we could see some disappointment and a dollar rally.

EURUSD daily chart
Looks to be breaking down from the rising channel. A retest of 1.30 is underway and a break below 1.2950 support area sets up 1.26 next.


GBPUSD daily chart.  the 61.8fib and 1.60 round number resistance is holding and a break below 1.5819 sets up 1.5560 and the trendline/channel bottom support..  A break below there and cable should correct to 1.53 next.


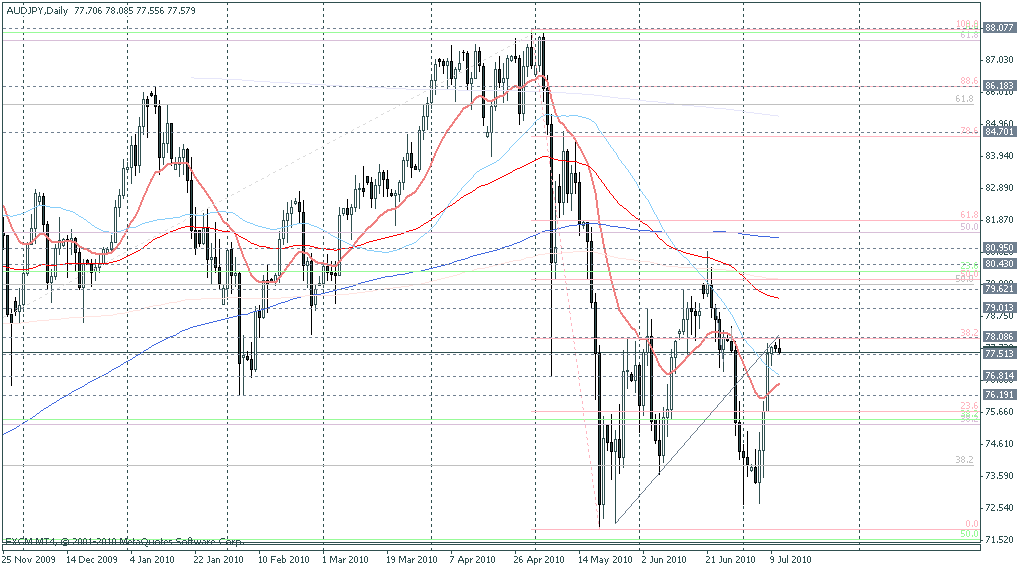
All the dollar crosses look to be rolling over, AUD and NZD particularly.  I don't see any good trades in the yen crosses, I am waiting for breakouts and with FOMC it is all about the dollar this week.

Wednesday, August 4, 2010

USD index and some charts

Although I am really on holiday it is ADP and NFP employment week so I have an eye on the markets.


The dollar index is bearing down on the 80.30-40 level which was major support in 12/04, 5/95 and 2/ 91 (not shown).  These support levels can be funny, just because it passed through it like butter last time, doesn't mean it won't suddenly be kryptonite this time, especially after such a long bearish run for the US dollar and sentiment so poor.  So it is definitely a level to watch for a possible dollar bounce.  The sentiment for the dollar is very poor but NFP could surprise to the upside.


Some major dollar crosses have a bit further to go before they reach potential turning points (I am looking for 1.35 for EURUSD) but some like sterling are already at big levels vs the dollar.
It is still early August but end of August is often a time when new trends emerge. 


Sterling has the bank rate and BoE MPC statement Thursday so I thought I would take a look at some sterling crosses.


Cable has hit the big round number 1.60 level which is also the 61.8fib retracement from the August 09 high to the May 10 low.  Having rallied with such momentum (and its best run in a lot of years) this could be a level for a correction but it could involve some chopping around and retests before it turns.  One to watch.  
A break above 1.60 says 1.6450 next stop.


GBPCHF Weekly chart shows it is back at the 50fib of the rally from the Dec08 lows to the Summer 09 highs and also at trend-line resistance from the July 07 high.  
The daily chart shows it has rallied to the 61.8fib retracement and also a big pivot zone.  A rejection here could should mean back to the lows at 1.58 or a breakout means back to the highs at 1.71.  
Nice size moves either way and I favour the downside and a possible measured move objective of 1.53 if the support at 1.58 does not hold.


If cable has stalled and EURUSD has further to run up it can only mean one thing for EURGBP.  EURGBP is hovering at the 50fib retracement of the rally from the lows and Mondays and bullish tail on Monday followed by an inside bar today suggest saving some energy for a move.


GBPJPY daily chart
Has been range bound for some time below the 50fib and 136.40 level, broke out Monday and has fallen back.  If cable stalls and USDJPY continues to drop this is going down too.


GBPAUD
This is a tricky one, consolidating.  Monthly doji and a weekly doji but in a rising channel and the 50fib retracement is holding so it could be that the AUD is more unloved than the pound.  Waiting for a breakout and more information.


GBPCAD
Weekly chart.  Broke out above resistance at 1.6230 and then banged its head on the 61.8fib retracement of the Jan high to May low.  Needs to  either break above the 1.64 resistance or go back and test the 1.6230 support to convince me it is going higher here but there is definitely plenty of room to the upside.  One to watch.

Monday, July 26, 2010

Sunday 25 July

I think I will take this week off.  It's summer and in Canada Summer doesn't last very long (at all).
Many markets at key resistance or close to it last week suggest we could pull back this week and I would be a buyer of dips in risk.  Breaks above and this meat grinder market will keep on going.
Good Luck!

Friday, July 23, 2010

Dow / indices


Dow has a bearish gartley on the hourly  and has made two equal swings off  Tuesdays low which is 70% reliable.  It is invalid above 10400 and first target is 10214 and pattern completion is that magic 10000 level.  If this pattern works to completion and not just a pullback then it is very hard to hold on to a bullish view.
The target 1, 50fib retrace would be a good buying point.

Friday

Gold has hit the 61.8 fib retrace of the drop from last week and I am adding to my short here.  It is also the round 1200 number and a bearish gartley pattern which means we should retest the lows.

I am waiting for the post-stress-test-euphoria-rally to buy EUR!!

Gold short 1201 stop 1206 PT 1175 - addition
EURAUD short 1.4460 stop 1.4510 PT 1.4260 (50fib retrace)
CABLE long 1.5355 stop 1.5320 PT 1.5630 (off 50fib retrace)
EURAUD closed 1.4410 post stress tests (+1R)
CABLE closed 1.425 (+2R) don't want to hold on weekend.

Open Positions:
GOLD short 1203 stop 1209 - 1/2
GOLD short 1201 stop 1206

Friday - UK GDP and sterling

STERLING
I am looking at sterling because UK prelim GDP is at 08:30GMT
Hard to call this one either way but its summer and Friday.  Could be monster chop followed by a euphoria rally after the EU bank stress test results later today.

Sterling index has formed a big head and shoulders on the daily.  I hate the pattern but it does show key support.


Cable is bullish, broke the descending trendline from the 09 highs, is in a rising channel and bouncing under the 200 day moving average.  If the GDP number is bad key support is at 1.51 and a break below that targets a deeper correction to 1.48.  If the bottom of the channel holds as support I am a buyer of dips targeting 1.56 & 1.61

EURGBP
I am bullish, looking for this break of trendline resistance to hold and targeting 0.86 then 0.8730-50


GBPCHF
Weekly charts shows sitting on key support at 1.5800 and a break of this support and there is no real support until 1.5100.  However the daily chart looks to have double bottomed and good news makes this a buy with a fib target of 1.66

GBPAUD
This pair moves inversely with risk.  I sold it because it broke trendline support today when the S&P broke trendline resistance.  Trend here looks to be down but I am cautious because the weekly chart still shows an uptrend.  A summer rally in stocks could send this back to the lows at 1.62

GBPJPY
Daily chart is choppy and sideways, rangebound between 131 and 1.36.  I am short and looking for a break of 1.31 but I am watching USDJPY for direction.  I favour the downside but its hard to reconcile with a summer rally in stock so more range trading perhaps.

GBPCAD
Rangebound and sideways, possible double top needs to break 1.5450 to confirm and if it does sets up 1.48 and another test of the lows.  A lower high and support here, followed by a break above 1.62 has a fibonacci target of 1.7050

Thursday, July 22, 2010

Thursday

Isn't summer trading great? :(
Good European data boosted risk this morning (UK retail sales, EU PMI and Hungary sold debt successfully) but lots of European data up shortly including CAD retail sales, US employment claims and then US existing home sales a bit later.  We will see what the mood of the market is.


GBPJPY short 1.3250 stop 1.3280 - addition
CRUDE short 77.00 stop 77.40 - addition
EURGBP long 0.84 stop 0.8370 PT 0.8730
CRUDE addition stopped out (-1R)
CRUDE short balance stopped out 77.50 (+0.5R)
GBPJPY short addition stopped out (-1R)
GBPJPY original short balance closed 1.3270 (+1R)
GBPAUD short 1.7180 stop 1.7280 PT 1.6700, break of yest low and TL
AUDUSD short 0.8940 stop 0.8965 PT  0.8860/0.8632 bearish butterfly
AUDUSD stopped out overnight (-1R)
EURGBP closed (+0.2R), will wait until after stress tests

Open Positions:
GOLD short 1203 stop 1209 - 1/2

Wednesday, July 21, 2010

Charts EURUSD

EURUSD
I have to admit it I was expecting higher (1.3190 would be projection of inverse head and shoulders, even though I hate the pattern) but EURUSD has put in a bearish engulfing candle or key outside reversal day off the 1.30 round number (also strong resistance summer 2006, early 2003) and it is also the 61.8fib retracement from the April high to lows. 
It is also a bearish butterfly pattern
Therefore I am looking for short entries targeting the 38.2 fib / 1.2570 area initially.

USDCHF has bullish long tails on the daily candles off the 1.05 support area and is an interesting buy back to 1.07 then 1.12.

AUDCAD might be an interesting short or at least an indication that AUD is a better short than CAD.
It is at the 50% retracement from the Nov 09 highs and also the breakout point where it broke from the long term wedge.  I am watching this one, I want to see a daily reversal candle because there is a danger we keep going higher to the 61.8fib at 0.94

----------

EURGBP long stopped out (-1R)
EURUSD short 1.2885 stop 1.2910 PT 1.2550
USDCAD balance stopped out 1.0410 (+0.5R)
EURUSD short stopped out (-1R)
EURUSD short (again) 1.2880 stop 1.2910 PT 1.2550
AUDCAD short 0.9175 stop 0.9205 PT 0.8850 - TL break
AUDUSD short 0.8830 stop 0.8860 PT 0.8550
CRUDE short 78.00 stop 78.50 PT 76.00
USDCAD long 1.0405 stop 1.0380 PT 1.074
AUDCAD stopped out (-1R)
EURUSD short closed 50% @3R 1.2790 (+1.5R)
USDCAD long closed 50% @3R 1.0480 (+1.5R)
CRUDE short closed 50% @3R 76.50 (+1.5R)
AUDUSD short closed 50% @3R 0.8740 (+1.5R)
AUDUSD balance 50% stopped out 0.88 (+0.5R)
USDCAD balance 50% stopped out 1.0430 (+0.5R)
EURUSD balance 50% stopped out 1.2850 (+0.5R)

Open Positions:
GBPJPY short 133.90 stop 1.3450 - 1/2
GOLD short 1203 stop 1209 - 1/2
CRUDE short 78.00 stop 78.50 PT 76.00 - 1/2


Tuesday, July 20, 2010

Tuesday update

The S&P has bounced pretty sharply off the 50fib retracement of the last swing.  If that holds as a low it is very bullish and we will make new highs in pretty short order. 
Corrections can be two swings and I would not rule out one more dip down, just because the market can :)  A dip back to the 61.8fib and the much fabled 1040 area from here means the measured move target lines up with the fib target too but just like when I try to play golf, the ball doesn't always get there as prettily as you would wish.

Tuesday July 20

Firstly apologies for not posting so much, I am fighting my way back but its a slog.  Hopefully next week I will be on all cyclinders and more charts.

Bank of Canada rate decision is due in 10 minutes.  96% of analysts say the BoC will hike and market has priced in a 25bps increase.  I am not so sure and if they do not hike then USDCAD will take off.  Yesterdays daily candle was a bearish hanging man so technically we are set for lower but I would buy any dips back to 1.04 area.  Tom (Trader Dante) pointed out the similarity in the chart to Sep/Oct 2008 and the same levels.
CADJPY is perched on 82.00 support.  A break below this level and trendline support has a fib target of 78.25 and a measured move target of 77.40
EURCAD is a very interesting chart, a break of the long term weekly trendline resistance.  I would be looking to buy dips and looking for price action at the 1.3330-50 area

USDJPY
The break of the 87.00 level is a biggie, 4hr chart is a bearish wedge at that level and we look set for lower.  I am bearish unless it gets back above 88.00

AUDUSD balance stopped out (-0.5R)

Open Positions:
USDCAD long 1.0380 stop 1.0350 - 1/2
GBPJPY short 133.90 stop 1.3450 - 1/2
GOLD short 1203 stop 1209 - 1/2
EURGBP long 0.8470 stop 0.8440 PT 0.8730

EURUSD daily chart
Trendline resistance from the Nov highs is broken and suggests higher prices but we are bouncing at a good 61.8fib.  I am looking to buy a pullback to 1.27 or 1.2550 looking for a target of 1.3190 and 1.35

Monday, July 19, 2010

Monday 19 July

I will post currency charts later but I am not sure the risk-off correction is over.

Crude short stopped out (-1R)
GOLD short closed 50% @3R 1285
New:
EURGBP long 0.8470 stop 0.8440 PT 0.8730 - TL break


Open Positions:
USDCAD long 1.0380 stop 1.0350 - 1/2
AUDUSD short 0.8785 stop 0.8810 - 1/2
GBPJPY short 133.90 stop 1.3450 - 1/2
GOLD short 1203 stop 1209 
EURGBP long 0.8470 stop 0.8440 PT 0.8730 

Weekly charts Indices Gold and Crude

Talks have broken down between the IMF, EU and Hungary and Hungary has been cut off from access to the rest of the IMF funds which is a risk-off tone for the start of the week and a weak HUF could drag down EUR and give a boost to the USD.  
China has pledged support for the EUR, no surprise.

USDJPY has broken major support at 87.00 and it will be interesting to see what will happen when it is retested, It is a Japanese holiday tonight (Sunday/Monday) so we may have to wait.

SPX
Rolled over after a tussle at the trend line from the April highs and weekly candle will close as a bearish doji without hitting the 50fib retracement from the highs.  Because it didn't make the 50fib it is either very bearish trend continuation and we will make new lows and the 890 area or we have more upside to come and will make the 50fib and 1120 area.  We are for sure heading lower as the week starts but because its summer and we are still in earnings I am leaning towards support holding and we go higher before lower.  Support at 1060 (flash crash low) or more likely 1040 should hold.  If it doesn't then we go to 950 next.

FTSE 4hr chart
Similar to the SPX, the break above the descending resistance trendline from the April highs makes FTSE a  more bullish chart than the SPX and a sign of things to come perhaps.


GOLD daily chart
Gold has stalled at the 50fib retracement from the March low.  Stronger support at the 61.8fib is around the 1164 level.  However if you trust measured moves and if Gold makes a second equal measured drop here then the target is around 1136.  A drop to the 61.8fib or the 78.6 fib at 1136 would be very interesting because it would mean a break of the long term weekly trendline from the October 2009 lows.
A break of this weekly trendline would be very interesting and would have a target between 973.9-905.2


CRUDE daily chart
Crude is in a rising channel which is bearish after being rejected at the 61.8fib from the April highs and then found support at the 23.6fib we are now back at the 50fib. Higher lows and higher highs suggest we are climbing our way back up.
Weekly chart could be construed as one big bear flag or rising wedge and a lower high here and a break back below 70.00 would be interesting as it is a break of the weekly trendline from the lows and projects a target of 60.17 - 53.80


Currency charts to follow Monday morning.

Friday, July 16, 2010

Friday

 ” [Michael Marcus - another top trader] taught me one other thing that is absolutely critical: You have to be willing to make mistakes regularly; there is nothing wrong with it. Michael taught me about making your best judgment, being wrong, making your next best judgment, being wrong, making your third best judgment, and then doubling your money. ” 
- Bruce Kovner
Thanks for the reminder 50Pips

Well I picked good levels yesterday but they didn't hold.  Its Friday and option expiry in equities, a good day to trade quietly and wait to see how the week ends.   

Commodity currencies (AUD, CAD, NZD) are weaker than the continentals (EUR, CHF, GBP) and better shorts at the moment IMO.
I still like yesterdays low to hold in the dollar index for a bounce but EURUSD and GBPUSD look like they could have a bit more room to the upside. 

The 50fib didn't hold in EURUSD so eyes now on1.30 round number and then the 61.8fib and the 1.3090 level which was pretty good resistance at the end of 2008 and early 2009.  (weekly chart)


AUDUSD 4hr chart - possible double top. 


USDJPY is again testing the yearly low at 86.96.  A weekly close below 87.00 is very bearish and means the yen crosses could be interesting trades coming up. 


SPX
Is clinging to the descending trendline from 26 April high. Yesterdays hanging man doji suggests a pullback could happen but might be a shallow summer correction.  Because of the chop I would like to see the purple trendline support broken to signal a pullback to 1055 area (50%) and risk-off.

GOLD
I was looking for a pullback to 1224-1235 area  to short but this bear flag seems to be quite shallow.  For the first time in two weeks price has penetrated the previous days low ... one to watch


Update:
EURGBP daily, break of this trendline targets 0.8730-50 then 0.89.  Buy on dips.


New trade:
AUDUSD short 0.8785 stop 0.8810 PT 0.8590
CRUDE  balance long from 75.20 closed 76.50 (+1.3R)
USDJPY stopped out balance (-0.5R)
GBPJPY short 133.90 stop 1.3450 PT 1.32
GOLD short 1203 stop 1209 PT 1164 - will cut if does not break 1200
CRUDE long balance closed 76.00 (+1.85R)
CRUDE short 76.00 stop 76.50 PT 74.50 - trendline break
USDCAD closed 50% @3R 1.0470 (+1.5R)
AUDUSD short closed 50% @3R 87.10 (+1.5R)
GBPJPY short closed 50% @3R 132.10 (+1.5R)

Open Positions:
USDCAD long 1.0380 stop 1.0350 - 1/2
AUDUSD short 0.8785 stop 0.8810 - 1/2
GBPJPY short 133.90 stop 1.3450 - 1/2
GOLD short 1203 stop 1209 
CRUDE short 76.00 stop 76.50 


Thursday, July 15, 2010

Thursday 15 July

Dollar index has hit my interim target of 82.70 and I think we bounce here.  The trend is still down as the DX has broken trendline support but we have a risk-off correction and some  back and fill due.
GBP looks like a better short than EUR or CHF.
CAD and AUD are better shorts than NZD (breaking wedge support in AUDNZD and AUDCAD about to hit 0.9250 reversal area)
If USDJPY breaks support at 87 then XXXJPY crosses are good shorts.
USDSEK is an interesting buy at this 7.3 level, good SR level and two equal swings down from June highs.
Gold is a good daily bear-flag forming.  I am looking to short between 1225-1235

New trades (half risk per trade as all very correlated):
EURUSD short 1.2895 stop 1.2920 PT 1.2515 - see chart weekly level
USDCAD long 1.04 stop 1.0380 PT 1.0490 / 1.0740
CABLE short 1.5350 stop 1.5410 PT 1.4870
CABLE stopped out (-1R)
USDCAD stopped out (-1R)
EURUSD stopped out (-1R)
USDCAD long 1.0380 stop 1.0350 P1.05 / 1.0340 - trying again 1/2 size

Open Positions:

CRUDE LONG 72.30 stop 71.70 PT 75.00 - 1/4 position
CRUDE long 75.20 stop 74.70 PT 79.50 - 1/2 position
USDJPY long 87.30 stop 86.90 PT 89.20 - 1/2 position
USDCAD long 1.0380 stop 1.0350 P1.05 / 1.0340

EURUSD weekly chart

CABLE daily chart - 1.5350 big level too


I will be back full time next week ... Be interesting to see where the weekly candles close.

Wednesday, July 14, 2010

Wednesday 14 July

I'm taking a little time off to feel better.
I am watching the long term descending trendlines in GBPUSD, EURUSD and the US indices and will post some charts tonight.  Today looks like a back and fill day.

USDJPY addition stopped out (-0.5R)

Open Positions:
CRUDE LONG 72.30 stop 71.70 PT 75.00 - 1/4 position
CRUDE long 75.20 stop 74.70 PT 79.50 - 1/2 position
USDJPY long 87.30 stop 86.90 PT 89.20 - 1/2 position


Tuesday, July 13, 2010

Tuesday 13 July

It appears risk is going to drift slowly upwards for a bit this week into option expiry.  The Greek bond auction has gone OK which is offsetting the negatives of Moody's downgrading Portugal and has helped EUR off the lows.
 The US has treasury auctions this week and it is one to watch.   The 10year yield is again back over 3% and this is weighing on USDJPY but should be higher ...  Watch the 10yr auction today and the 30yr tomorrow for more direction.  On the NYSE yesterday was the lowest volume of 2010 so far, so the summer doldrums are officially here.

EURGBP looks to be correcting down and has broken trendline support.  I still like EURGBP long on a pullback (target 0.8750-0.89).  I would look to buy at the 0.82-0.8240 area  or a good entry would be the break of the descending trendline resistance from the March highs.

Will post charts for the crosses later today, there look to be some good trades setting up slowly.
I apologise I am not around much, I am not feeling too good this week.

CRUDE long 75.20 stop 74.70 PT 79.50 - addition
EURAUD short 1.4340 stop 1.4410 target 1.40 / 1.3540 ~ sold break of yesterdays low
EURAUD stopped out (-1R)  nice squeeze in EUR
CRUDE closed 50% @3R 76.70 (+1.5R)
USDJPY long 88.10 stop 87.80 PT 89.70 then 91.00

Open Positions:
CRUDE LONG 72.30 stop 71.70 PT 75.00 - 1/4 position
USDJPY long 87.30 stop 86.90 PT 89.20 - 1/2 position

Update:
Breakouts in cable and EURUSD mean a re-test of the highs and possibly new highs ... beware summer chop.

Monday, July 12, 2010

Monday 12 July 2010

Cable has broken down through 1.50 at the open.  I skipped shorting the break and I am waiting to see how the daily candles close across all the markets as we are at key inflection points closes.

GBPCAD balance closed 1.55 (+2.4R)
USDCAD balance closed 1.0350 (+2R)
New trade:
GBPAUD SHORT 1.7150 stop 1.7210 PT 1.69
GBPAUD stopped out (-1R)

Open Positions:
CRUDE LONG 72.30 stop 71.70 PT 75.00 - 1/4 position
USDJPY long 87.30 stop 86.90 PT 89.20 - 1/2 position

Weekly charts and analysis

Risk Rally looks set to continue but we could be due for some back and fill first ( AKA chop) ...
I am finding it hard to see trades jump out at me as we start the week, I am going to be watching for direction before jumping in to anything.

Today China announced a much bigger trade balance than expected at $20bln vs just under $14bln expected.  This is good for the risk trade although obviously not for global imbalances.
Breakouts in "risk" commodity currencies and really good employment numbers for Australia and Canada are helping.
Sterling is the weakest of the bunch but watch the BP news, sterling sold off on bad news from the Gulf of Mexico so news that BP have re-capped the spill and interest from PetroChina in BP and that BP is shedding US assets might give it a boost.
We are coming into earnings season and lets say that expectations are not too high.  Bearish sentiment among stock market investors remains at the highest level since March 2009,.  Last June Alcoa surprised with earnings 30% better than expected and this June could again surprise the market to the upside.

S&P
Weekly bullish piercing line reversal pattern.  I think this run has a little further to go before we hit the descending weekly trend line from the April highs.  I would expect a pullback there (perhaps to the flash crash low SR level) and then another push higher.  My upside target still 1120-1140.

FTSE
Weekly bullish engulfing candle has FTSE back in its ascending channel. and has also broken trendline resistance from 26 April.
Buy dips (perhaps back to 5100) and upside target is 5450


GOLD
Gold has rolled over but fall is halted and the weekly candle is a good looking bullish long legged doji.  I think there is more downside to come for Gold and better prices to buy.  The upside target for this swing is 1227-1234 but I am waiting for price action to sell there with a downside target of 1150-1160

CRUDE
Weekly bullish piercing line.  Crude is now retesting the ascending channel it fell out of and could find resistance here.  I am looking for a pullback to the 74.50 area to buy again with upside targets of 79.50 and then 81.50
Watch the news this week, BP recapping and sealing the leak in the Gulf of Mexico could be bullish for crude (and if it fails bearish).  Monday 19 July  is the rollover of the front month (August) contract and that means Friday could be quite volatile.

Currencies - Majors

EURUSD
Not a big bullish week for the Euro, constrained at the top of a rising channel this could be be setting up an interesting short. EURUSD has fallen just short of two equal measured moves off the lows and short of the 50fib retracement which makes me think we could have one more push higher before we correct down. I am not usually a fan of head and shoulders patterns but on some markets they work better than others and the one on EURUSD could mean much higher levels than people are anticipating.  One to watch because opportunities could be setting up here: one more push higher and a breakout to 1.2880 and then 1.31, or a dip back to the bottom of the channel before a move higher.

GBPUSD
Cable is at triple top resistance and looks to have rolled over but trapped between support at 1.50 and resistance at 1.5250.  It is interesting that it hasn't touched the long term descending trendline which makes me think the 1.50 level could hold and we get one more push up from here before rolling over.  I am watching this one closely because if the market pulls back cable (risk off)  is a good short but to get me in it has to retest the descending trend line and hold, or break 1.50.  A break of 1.50 sets up 1.48 next

USD CHF
USDCHF is sitting on a big pivot level at 1.05 / 1.0450 and also the 61.8fib retracement of the move off the Nov09 lows and May 10 highs.  I am looking for this support to hold here and a move back up to 1.09 / 1.102  No price action to get long yet but one I am watching for it.

USDCAD
Sitting on strong support and the big 2008 pivot level at 1.03  I am looking for this support to hold and a correction here but no price action to buy yet.  Stronger support could lie at 1.0220 so one to watch.  A bounce back to 1.0450-1.0490 would be a good spot to add some shorts with a downside target of 0.9950

AUDUSD
Higher low is in place, and Aussie has broken trendline resistance.  I am looking to buy pullbacks (perhaps to 0.87 or 0.8550-80) with an upside target of 0.8880 and then 0.9100

NZDUSD
Not the best looking trade out there, consolidating sideways in what could be a big flag pattern.  Pass, wait for more information.

Currencies - Yen crosses


USDJPY
No change.  A bullish bounce off the 0.87 SR level, USDJPY has resistance at 89.25 and the daily 20 EMA but I am still a buyer of dips (88.20?) with an upside target of 89.90 initially and the descending trendline resistance.  A break of the trendline means that 91.00 and then the big 91.80 level is next.

EURJPY
Two equal swings off the low at 107.30 could mean EURJPY is set to pull back here and pull back to 110.50 or 109.35 where I would be looking for price action to buy.  I really want to see a higher low and then a break above 112.70 gets me long with a target of 117.60 then 119.50, watch out for strong resistance at 1.14

AUDJPY
A big bullish move off the lows failed to break the previous weeks high and stopped at the 61.8 fib retracement of the drop from the June highs.  I expect a pullback here to  76.20 or 75.70 area and then a move higher to 81.90

--------------------

More charts - the crosses to follow ...

Friday, July 9, 2010

Dollar Index

The big question is when is this swing going to be over for the US dollar and when do we buy it again.  I am not ready to buy dollars quite yet looking at the dollar index.

I am looking for two equal corrective swings down (shown as turquoise lines), which gives me a target of 82.71 which is also just above the April swing high for the dollar index, the May swing low and the 61.8 fib retracement.
When the we get there I will be ready to buy the dollar again and I think we see the next swing.  Until then I am holding off.

When Fortune and CNN start saying Central banks start to abandon the U.S. dollar then you know a reversal is not far away.