Friday, July 9, 2010

Friday

It's Friday and it is summer.  If I didn't have any trades open I would probably take today off.
Canadian employment numbers have come in this morning adding 93,200 jobs which is huge and helped my CAD trades reach their fib targets.
There are flags or equal triangles on a lot of markets.  Cable consolidating below resistance, EURUSD at the top of the channel.
It is one of those days when they could break either way.  We could roll over and do some back and filling with jitters pre-earnings or we could roll over and restart the down trend.  I personally think we could see higher prices and better levels to sell from so I am in the back and fill before another leg up camp.

S+P has stopped at the 50% back of the last swing (June high to lows).  A reversal here would not be good for the bulls and means a retest of the lows and possibly new lows.  I would prefer to see the down-trending resistance line and the 61.8fib tested first.


Because AUDUSD has broken above the descending trendline and the flash crash 87.00 level and found  support off it.   I think it is likely we see higher prices and some breakouts.  AUD and CAD are good risk indicators usually and I intend to buy a breakout of this consolidation or a retest of the 0.8700 level.

CRUDE
I am holding on for 76.50-77.00 before we roll over and do some back and fill rolling over and rejecting off the previous trend-line support would be bearish and get me out and likely short next week .   I am holding on the the last 1/4 of my long trade but open to a reversal at this point.

USDJPY
A good bounce off the weekly SR level at 87.00.  I am holding for a second swing up to 89.20, the 61.8fib retracement of this swing and the 50% retracement of the bigger swing and the descending trendline.

My Gold short is taking its time. The weekly looks set to close as a doji so it could go either way.

Trades:
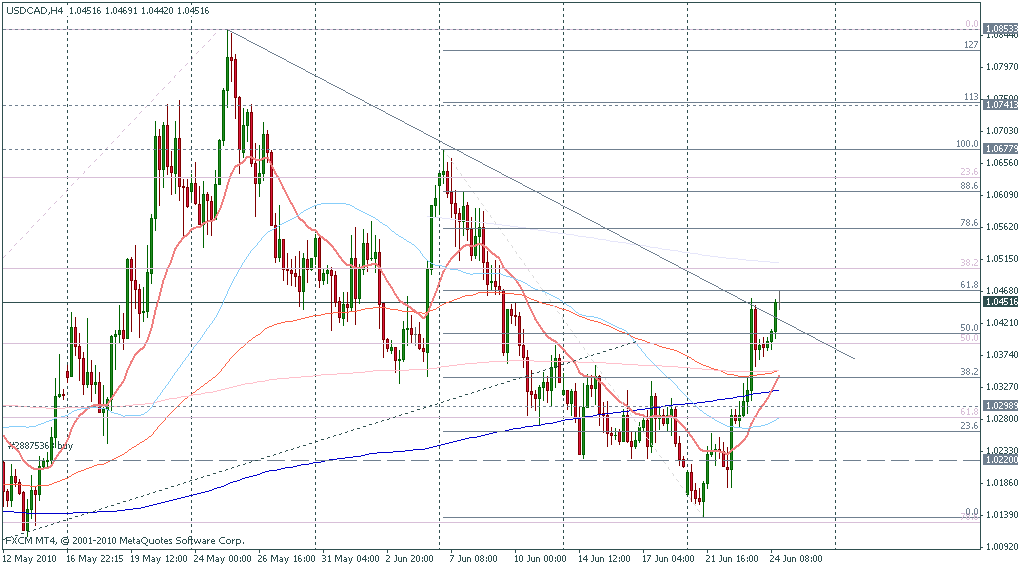
USDCAD closed 25% @ 6R 1.0420 (+1.5R)
GBPCAD closed 25% @6R 1.5695 (+1.5R)
GOLD stopped out  (-1R)

Open Positions:
USDCAD short 1.0600 stop 1.0630 PT 1.0410 - 1/4 position
CRUDE LONG 72.30 stop 71.70 PT 75.00 - 1/4 position
GBPCAD short 1.5995 stop 1.6045 PT 1.5610 - 1/4 position
USDJPY long 87.30 stop 86.90 PT 89.20 - 1/2 position

Thursday, July 8, 2010

Charts

EURUSD is very close to the top of its ascending channel and about to hit descending trendline resistance from the December 09 highs.  It is coming close to levels where I would not be surprised to see it pullback and do some back and filling before a move higher.
At 1.27411 EURUSD would have made two equal swings up from the lows and markets love symmetry ...

EURGBP is at that level too.  daily chart.
If we get a 50% retrace of the up move here we have a pretty good looking inverse head and shoulders (perhaps).  It is not my favourite pattern but on some currencies like sterling it works well.  If the 0.8380 high gets taken out then EURUSD is going to break out as well and the next resistance for EURGBP is 0.8425 and the 113 fib which is also close to the 50% retracement from the May high.  I still like EURGBP higher and I would buy the pullback.

Radio Interview

Euodoo Trading - a great website for traders and especially new traders did an interview with me this week.
I think I sound awful but you might enjoy some of the other interviews and stuff there ;)

My interview

Thanks Euodoo - I am very flattered.

Thursday 08 July

No change for sterling this morning but the ECB press conference is coming up in short order.  Cable and EURUSD have been trading sideways while the commodity currencies put in a big rally while we wait for this news and a no-change might trigger them to play catch-up.
As Macro-Man pointed out yesterday, there is the potential for a "tape bomb" from Mr Trichet.  After an impressive rally from the lows EURUSD is coming up on trend line resistance from the Dec09 highs.  
Cable has traded sideways this week after a six week rally off the lows and a sharp dip here would not be a surprise but with the risk rally looking set to continue I would buy any dip back to 1.48, Cable is also close to descending trendline resistance from Oct09 highs and a break of the trendline sets up 1.5550 next resistance.  Cable is also a bearish Gartley fibonacci pattern (invalid above 1.5350) a pattern that has a 70% success rate so I am holding onto my other sterling shorts into the news.
EURGBP is approaching previous resistance at 0.8382 which is also fib resistance, but I expect it to take out that swing high and I would be a buyer of dips looking for 0.8420

AUD added 46,000 jobs last night vs 15,000 expected and has broken it's descending trendline resistance and my upside target.
All in all this risk rally looks set to continue.  The 87.00 level in USDJPY that I mentioned last week has held and JPY crosses look like good buys again.  EURJPY inverse head and shoulders projects a target back at the top of the range at 114.00 and I am looking for a buy entry on a pullback to the 110.85 area.

Gold has retested the breakout level at 1207 and shorts look good to continue.

US unemployment this morning might take the shine off the rally.  How this weeks candle closes is very important for the indices, failed patterns (like head and shoulders) can be powerful trades.
-------------------------

GBPCAD closed 50% @3R 1.5845 (+1.5R)
AUDUSD closed 0.8740 past target and 78fib (+2.2R)
GBPAUD closed balance 1.73 target (+2.5R)
CRUDE closed 25% @6R 75.30 (+1.5R)
USDJPY closed 50% @3R 88.20 (+1.5R)

Open Positions:
USDCAD short 1.0600 stop 1.0630 PT 1.0410 - 1/2
GOLD short 1199 stop 1209 PT 1166
CRUDE LONG 72.30 stop 71.70 PT 75.00 - 1/4 position
GBPCAD short 1.5995 stop 1.6045 PT 1.5610 - 1/2 position
USDJPY long 87.30 stop 86.90 PT 89.20 - 1/2

Wednesday, July 7, 2010

Wednesday 07 July

Is the tumble in the indices going to keep tumbling here or bounce, is the big question.  If we collapse it will one of the most anticipated crashes ever which makes me think we are less likely to.
The charts are bearish, the trend is down and the S&P has broken the neckline of the big head and shoulders that everyone is looking at.  For the bullish bounce to have any power the S&P has to close back above the 1040 level and until then we bounce around. A close below 1000 would mean the 50fib at 943 is next.
Possible double bottom in AUDJPY at 72.70 suggests we could bounce still.  I like AUDUSD long better.  Yesterdays candle was a bullish engulfing and we retraced 50% and look all set to head higher.

EURGBP in a stair climb north headed for 0.8430 makes EUR a better long and GBP a better short trade.
GBPAUD has broken trendline support and forming a bear flag, I like this as a short if the market decides it is risk-on.   
EURCHF looks like it is about to roll over and retest the lows which makes GBPCHF an attractive short and a break of the weekly wedge sets up 1.58 and 1.5485.  I like the GBPCHF and GBPAUD trades a lot.  Will post some charts later.
Horrible day with crude yesterday, I will be watching my risk today.

AUDUSD long 0.8475 stop 0.8445 PT 0.8700
CRUDE LONG 72.30 stop 71.70 PT 75.00 /
GBPCAD short 1.5995 stop 1.6045 PT 1.55
GBPAUD short closed 50% @3R 1.7720 (+1.5R)
AUDUSD long closed 50% @3R 0.8565 (+1.5R)
USDCAD short closed 50% @3R 1.0510 (+1.5R)
CRUDE long closed 50% @ 3R 73.80 (+1.5R)
USDJPY long 87.30 stop 86.90 PT 89.20 SR level
AUDUSD closed 25% @6R 0.8655 (+1.5R)
GBPAUD closed 25% @6R 1.7540 (+1.5R)

Open Positions:
GBPAUD short 1.7900 stop 1.7960 PT 1.7450 / 1.73 - 1/4 position
USDCAD short 1.0600 stop 1.0630 PT 1.0475 / 1.04 - 1/2
GOLD short 1199 stop 1209 PT 1166
AUDUSD long 0.8475 stop 0.8445 PT 0.8700 - 1/4 position
CRUDE LONG 72.30 stop 71.70 PT 75.00 - 1/2
GBPCAD short 1.5995 stop 1.6045 PT 1.55 
USDJPY long 87.30 stop 86.90 PT 89.20

Tuesday, July 6, 2010

Tuesday 06 July

Big face ripper risk rally this morning in London session, I wonder if it will continue in the US session after grim predictions of a double dip over the weekend.
My view on the pairs has not changed since last week and will post full run down here later.
I like AUD and CAD best of all and as USDJPY is rallying too all the yen crosses look like good buys on dips while this risk bounce continues.

AUDUSD long balance stopped out - from last week (-0.5R)
New trades:
GBPAUD short 1.7900 stop 1.7960 PT 1.7450 / 1.73
CRUDE long 72.80 stop 72.40 PT 75.20 / 76.15
USDCAD short 1.0600 stop 1.0630 PT 1.0475 / 1.04
GOLD short 1199 stop 1209 PT 1166
CRUDE stopped out (-1R)
CRUDE long 72.10 stop 71.80 PT 75.20 / 76.15
CRUDE stopped out again (-1R)

I am looking to sell USDCAD / buy AUDUSD / AUDJPY / CADJPY on pullbacks if I see and entry.
Gold is a very good looking short - 4hr / daily chart is a bear flag below the previous trendline support.

S&P has broken trendline resistance and out of its channel so it looks like the risk rally is set to continue.  Upside fib target 1070 and 1085


NOTE
For some reason comments are not working unless you post as anonymous so I have disabled the log in.  Post as anonymous with your name or it won't work for now.

Friday, July 2, 2010

NFP - risk bounce?


My favourite fibonacci trade is to enter at a pullback to the 61.8fib and the first target for the trade is the 38.2 fib and then I expect a pullback to the 50fib where you add.
This is where we are on the S+P.  Here is a chart from the excellent blog "Afraid to Trade" which I am using because other peoples charts always manage to look cleaner than mine:
We have bounced off the 61.8fib retracement and hit target 1 at 38.2fib and now we *should/could* retrace back to the 50fib.  This chart does look really bearish but markets never move in a straight line and I would not be surprised to see a pull back to the 50fib level at 1121 and then see what happens when we get there.
It has been an extreme bearish week:
There are currently more stocks in the S&P trading below their 50 day moving averages (97%) than there were in the March 09 lows.
29th June was the worst single day for advance / decline readings in the S+P at -498 (1 advance, 499 declining stocks).  Since 1990 this has only happened on one  other day ~ 29 September 08.
Statistically highs or lows for the month are four or five times more likely to occur on the first of second of the month than any other day.
Oscar's three-day-holiday-reversal-rule says that after a three day holiday the market moves in a reverse direction to the trend of the week prior to the holiday.

I could be completely wrong (I often am) but at some point the market will test the breakout of the "head and shoulders" at 1040 to see if it is now resistance and if it doesn't hold then we could be set for 1121.


GOLD
The big news today was the Spanish bond auction went well.  That is a big deal because in Europe Greece is affordable and Spain is not.  If much of the rally in Gold was over sovereign debt fears and the Euro then those have been (temporarily) alleviated by Spain being able to sell it's debt so it is logical for Gold to retrace.  This might explain why gold was falling along with the dollar and TIP's today.
The trendline break says that an interim top is in and I am waiting to short again 1220 (50% daily retrace) or 1227 (50% swing retrace) 

EURUSD
The close above 1.25 is bullish for EURUSD and the long daily marabuzo gives good levels to look for pullbacks for long entries.  If you are bearish you could short EURUSD here at 1.25                                                   I am looking for price action at 1.2380 and 123.30 to get long again and if I am wrong it will just keep going down :) to 1.2150 where I am definitely a buyer.
My upside targets are 1.2670 and the descending trendline resistance and then 1.3090

USDJPY weekly chart
USDJPY is correlated with 10 yr treasury yields.  If yields go down, so does USDJPY. 10yr yields are at big lows but also technical resistance today (2.883 is the 1.27fib extension and 2.79 is the 61.8fib retracement from Dec08 to June 09) so it is likely to bounce here and therefore along with it the yen crosses.  USDJPY is also at 87 - a level where it found good support in  Dec08 and Jan09.

Finally EURGBP is at 61.8fib retrace of last swing and should dip back to 81.80 here which will help cable up and EURUSD to pullback.


Trades:
AUDUSD closed 50% @3R 0.8495 (+1.5R)
EURAUD stopped out (-1R)
CRUDE short stopped out (-1R)

Open positions:
AUDUSD long 0.8420 stop 0.8395 PT 85.90 - 1/2

Thursday, July 1, 2010

Thursday 01 July

It is Canada Day and I am not doing much today.  It is setting up for a risk-on bounce.

CRUDE
4hr chart.  At the bottom of the channel and at the 74.50 pivot level.  I am waiting for reaction to the data at 10:00 NY time but a break here has a target of 72.00 and the 61.8fib.  Risk on would  mean a trip  back up to the top of the channel potentially.

AUDUSD
Pullecd back to the 61.8fib and price action is now bullish. Break up through the descending channel line has a target of 86 and possibly 87.00
AUDUSD is a bigger bullish butterlfy pattern.
Could be one more swing down for AUDUSD from the top of the channel if the market does not like the numbers.

GOLD wedge break and potential trendline break targetting 1200 and 61.8fib


EURJPY 4hr chart
Upside targets 110.70 - 111.50

The sharp spikes up this morning in cable and EURUSD are tempting shorts if the data is bad ...
I also like EURAUD short at the 61.8fib retracement.

CRUDE short 74.20 stop 74.60 PT 72.00
AUDJPY short 73.60 stop 74.10 PT 71.90
GOLD short 1230 stop 1239 PT 1200
CRUDE closed 50% @73.00 (+1.5R)
CRUDE closed balance 72.20 (+2.5R)
GOLD closed 12.08 - 1.41fib extension (+2.4R)
AUDUSD long 0.8420 stop 0.8395 channel breakout PT 85.90
AUDJPY closed out, not working (-0.8R)
CRUDE long 72.50 stop7190 PT 74.30 - 1hr wedge, 4hr bullish gartley countertrend to re-test channel
EURAUD long 1.4850 stop 1.4970 off 61.8fib PT 1.4530 / 1.4315

Will add another Gold short next rally...

Update:
Very bad US data ... Equities are falling and so is USDJPY because bond yields cannot rise on that data.  Collapsing yields do not support USD strength but EUR and Cable setting up good shorts for tomorrow

Wednesday, June 30, 2010

Wednesday 30 June

Not around today but back tomorrow, sorry and Thursday is Canada Day.

Today is last day of the month and quarter and can be an odd duck day when currencies that have been beaten down get bought and currencies that have outperformed get sold.  On that basis GBP, JPY and CHF may have a bad day and EUR, AUD get bought, etc.  Also the last day of the month often sees a jump in EURGBP due to flow in the London session.

Good luck!

Tuesday, June 29, 2010

Tuesday 29 June

It's Turnaround Tuesday my (least) favourite day of the week!
Big breakouts, gaps down and moves overnight.  It is end of Month / quarter / half year rebalancing so things could get whacky.
Here is what I am looking at to see which way we go ...

EURUSD at 1.2140 is the 50% retracement of the June rally off the lows and also where EURUSD has made two equal swings from the 21 June high and is also a level where buyers have come out before.   The equal swings make 1.2140 more likely support than the 61.8fib at 1.21   If EURUSD is going to get a foothold and reverse that is the level I am looking at.
CRUDE 75.50 - 74.75 support area, 50%back, two measured moves and trendline support.
AUDUSD 85.00 round number support, two equal moves and previous resistance becomes support.
Measuring the wedge in the SPX and projecting it from the breakout point suggests 1050 target for SPX

CRUDE short closed 50% @3R 77.75 (+1.5R)
AUDUSD short closed 50% @3R 86.90 (+1.5R)
NZDJPY short closed 50% @3R 62.50 (+1.5R)
AUDUSD  short closed balance at 85.50 target (+5R)
NZDJPY short closed balance at 61.60 target (+3.3R)
EURGBP short closed 81.00 (+2.5R) - 1.41 fib ext
EURJPY short 1.08 stop 1.0840 target TBD
CRUDE short closed balance 75.50 (+5.4R)
EURJPY short closed 1.07.75 - not working (+0.5R)
EURUSD long 1.2165 stop 1.2140 PT 1.2340
AUDJPY long 75.35 stop 74.95 PT 77.40
CRUDE long 75.50 stop 75.20 PT 77.00
CRUDE long stopped out (-1R)
CRUDE long 75.25 stop 74.85 PT 77.00
FTSE long 4902 stop 4882 PT 5031
FTSE short stopped out (-1R)
AUDJPY short stopped out (-1R)
EURUSD closed 1.22 - market shanking (+1.4R)
CRUDE closed 75.50 - market shanking (+1R)


Open positions: FLAT


Update:
I am really not sure what today is going to do, I think we could rally and I have closed my shorts from yesterday to protect profits and because they hit targets but if today sets up to be a big fatfinger-dump-continuation day then I will get back in short.

Monday, June 28, 2010

Intern in return for mentoring in FX trading

A friend of mine and a very good professional FX trader is looking for some help, around 5+ hours a week (time of day not important and you work from home) in return for mentoring as an FX trader and live room trading education.
Click here to see if it is of interest too you
This is a pretty good offer :)

Monday 28 June Indecision

A sideways choppy day with most markets consolidating in low volume.

S&P is forming either a triangle before a big move to the upside from the bottom of the channel or a bear flag which will break to the downside and see us retest the lows.  I am still leaning towards higher but open to both.


EURUSD looks to have broken down out of its channel.  It had big falls today vs GBP & CHF.  (But dollar buying vs SEK helped support EUR on rumours of a 0.25bps hike later this week & EURSEK is more liquid that USDSEK)

AUD, CAD and NZD traded sideways and AUD did not collapse with the big fall in Gold.
The June 2010 COMEX gold futures contract expired today. The rollover to the next contract likely contributed to this morning's plunge and means Gold could snap back sharply.


The S&P breakout will likely give the direction for risk for the next few days so time to wait and see ...


Open positions:
CRUDE short 78.75 stop 79.05 PT 77.00
AUDUSD short 87.50 stop 87.70 PT 86.60 
NZDJPY short 63.25 stop 63.50 PT 62.60 / 61.80
EURGBP short 81.75 stop 82.05 PT 80.25

Sunday 27 June

I am expecting risk to rally this week after last weeks pullback and the flat Friday into the G20.  The slide in equities halted when the financial reform bill became a done deal, 2300 pages of new regulation that doesn't seem to address too big to fail, leverage, supervision, the ratings agencies or Fannie and Freddie.  
Rien ne va plus.
Spookily at the request of the Chinese there was no mention of the Yuan in the G20 communique tonight.

Spreads on Greek bonds were really ugly last week which should have been more bearish for EUR but HSBC say it may have just been due to IBoxx changes

Difficult days will be end of month/quarter/half year on Wednesday where managers rebalancing could favour undervalued currencies over the star performers.
Friday is NFP 

S&P
Weekly is a very bearish engulfing bar halted which found support at the 61.8 fib retracement of the rally from the lows and also the 01/02 June swing low.  I have two scenarios for the S&P.  Bigger picture and using measured moves I expect an upwards move equal to the one off the lows that takes the cash price to the 1158 level.  But I can't ignore the weekly candle and that may mean we only rally to 1108 (61.8fib retracement of last weeks down move) and then rolls over and retests the 1040 lows.  
We will find out when we hit 1108 but  I am leaning towards the more bullish one because I think we may be in a rising channel which is much easier to see on the FTSE.

FTSE
I am bullish FTSE off the bottom of this channel as long as it holds but longer term bearish.  The weekly candle is a big bearish engulfing and price appears to be setting up a big weekly bear flag pattern (downside target 4300) but I think we have one more run up before we go down but we may only make 5230 resistance instead of the top of the channel at 5380


Dollar Index 
The bearish correction in the dollar index continues and I am looking for it to reach the 0.618fib retracement at 83.35 and the long term descending resistance line.  However a measured move equal to the one down from the highs would target 82.50 and previous SR level of the 

GOLD
Weekly hanging man doji is a possible bearish reversal for Gold but it is hard to sell against such a strong uptrend when the pullbacks are so shallow.  I am looking for the high to be retested or a daily reversal candle before I short based on the weekly candle.  More likely is a measured move equal to the rally from 219 April to 15 May which has a target of 1290 area which is also the 1.27 fib extension target.  If you are bullish you could look for a pullback to 1240 or 1250 SR level to get long.

CRUDE
Weekly is a perfect hanging man doji after a big rally on Friday on news of a storm in the Gulf of Mexico, now Hurricane Alex, which could be a bearish reversal and it is also the 618fib retracement of the big fall from the April highs.  The hurricane and the falling dollar could keep a bid under Crude and makes me cautious and leaning towards bullish.  
I like it short to start the week and then I would buy a pullback  (77.00-77.50 maybe) with a target of 83  

Major currencies

EURUSD daily chart
Weekly is an inside bar pullback and daily is bullish.  This looks to be consolidating and not the best looking trade out there.  I would buy a retest of 1.2330 or 1.2150 with a long target of 1.2650 initially.  A break of the descending trendline sets up 1.30
GBPUSD
Weekly and daily bullish cable has closed above the 61.98fib retracement and above the 1.50 round number level.  Still forming a big bearish gartley pattern on the daily cable is set to push higher first I would buy a successful retest of 1.5010 with a target of 1.5250 and possibly 1.5350. If 1.50 does not hold 1.4850 is next support for a long entry.

USDCHF 
Bearish correction has stopped at 61.8 fib retracement and Feb swing high levels.  I expect a bounce here, and I am looking for price action to sell again at 1.1230 or 1.14 to short.

USDJPY
Weekly and daily bearish but price now stopped at 89.00 and ascending trendline support and a pretty good pivot zone where bids usually appear.  Longer term I am bearish USDJPY back to the 09 lows but I like USDJPY long above this trendline to 0.91.  A break of 89.00 has an equal measured move target short of 88.10 and a retest of the flash crash low.

AUDUSD
Weekly high wave doji, sideways consolidation.  Like the S&P I am not sure of direction and neutral waiting for more information.  The daily is a bearish Gartley but if stocks continue to rally the pattern will fail.  I am watching for .087 to hold as support and if it breaks then price action at 0.8550 to buy.  Below 0.85 and I am looking for a retest of the lows at 0.8070


USDCAD
Weekly bullish engulfing, daily is bearish reversal off the top of a descending channel / weekly bull flag and 618 fib retracement.  Daily could be forming an inverse head and shoulders.  Like AUD the picture is not clear and we could have some more sideways consolidation but within the channel I favour more downside moves to 1.03 or 1.0220 and will look for price action there.  A break of the channel to the upside means a test of 1.05  Until then I am waiting for more information.

NZDUSD 
Almost at the top of a clear descending channel I like this short below 0.72, first target 0.6580 support then 0.6260.  A break of the channel to the upside has a target of 0.7630 high. 

EURGBP
Bearish weekly engulfing candle, daily bearish but testing big weekly SR level at 0.8180
There is the potential for a bounce here with a potential double bottom on the daily and the upside target would be 0.8425 / 0.8550.  A break and close below 0.8180 means next stop 80.25

EURJPY
The 108.85 level is two equal measured moves down from the October 09 high and two consecutive daily dojis at the end of last week looks like EURJPY is trying to correct higher and could be a lower high.  I like this long and a break of 113.40 and 114.0 then has a target of 116.80 and then 120.00

GBPJPY
After trading sideways for a couple of weeks this one is due for a breakout.  I like this long and I would buy a dip to 1.32 or a break of the upper trendline and upside target is 139.25

AUDJPY
Bearish, AUDJPY has made two equal measured moves off the lows and the weekly candle is a bearish engulfing.  I like this short initially with a downside target of 75.50 where I will be looking for price action to buy.  Possible support at 76.80 and the flash crash low.

EURCHF
Bearish and ugly.  There is a bearish bat pattern setting up on the weekly chart and I am looking for a drop from here to 1.32 area where there will be two equal measured moves down from 21 may high and it is the 61.8fib extension of the first swing. My bias is short to 1.32 and a buyer off that level.

GBPCHF  weekly chart
I like this short!  Triple top, descending trendline resistance from the 07 highs.  Short targets 1.6090,  1.58

Monday trades:
CRUDE short 78.75 stop 79.05 PT 77.00
AUDUSD short 87.50 stop 87.70 PT 85.50
USDJPY long 89.40 stop 89.10 PT 90.30
NZDJPY short 63.25 stop 63.50 PT 62.60 / 61.80
USDJPY stopped out (-1R)
EURGBP short 81.75 stop 82.05 PT 80.25

Sunday, June 27, 2010

Sunday 27 June

I am late with analysis but working on it now and will have it up later.  Most markets at inflection points and I am looking for a small pull back and a risk rally this week.

Friday, June 25, 2010

Friday 25 June

I am thinking about exiting my shorts on down swings today and getting flat over the weekend.  The G20 is setting up for some disagreements and I am not comfortable gaming central banks.
I am expecting a bounce either in the US session or the start of next week and another swing up .... how far that upswing takes us is anyone's guess.

EURGBP looks to be double bottoming above weekly SR but spreads on Greek bonds are at record wides again and yields on 10 yr Greek paper are over 10%.  It makes you wonder how long the EU will keep buying all this stuff.  I am still looking for a bounce in EURGBP to 83 initially then 85.50.

CHFJPY stopped out - TL break - (-1R)
GBPAUD stopped out (-1R)
GBPJPY short 134.00 stop 1.3450 PT 132.00 - see chart from yesterday
CRUDE 1st short closed balance @ 76.00 (+1.8R)
CRUDE 2nd short closed balance @76.00 (+1.3R)
AUDJPY closed balance 1st short 77.10 (+2.8R)
AUDJPY closed yest short 77.10 (+2.2R)
CABLE short closed @3R 1.4860 (+3R)
GBPJPY short closed 1.3350 (+1R)

Open positions:
Flat


CABLE has broken and retested the trendline resistance I was looking at (thick line) and now looks set for higher next week.  


USDJPY is at the bottom of its channel and finding support.  It is a bullish bat fibonacci pattern so I am looking to buy this pair.


Hence I have now also closed GBPJPY shorts.  If another drop shapes up today I will re-short because this set up looks best to me.


EURUSD 
Possible right shoulder of an inverse head and shoulders forming but holding below 1.2330 SR and broken short term trendline support.  A close today between 1.2150 and 1.2465 makes it a weekly inside bar and a pullback in a possible bigger uptrend targeting 1.26


GOLD
Gold is at big SR resistance at 1250 and also the 61.8fib retracement level.  For me this is a low risk entry short, even though it is against the bigger up trend.

Thursday, June 24, 2010

Thursday 24 June

As I said last night I am still in sell rally mode.  With big moves in the London session the US session could start with a bit of a rally but I am still looking for 1078 then 1065 in the S+P and 73.75 in crude and 1222/1215 next in Gold.
The move down in EURGBP has been relentless and stopped cable falling but below the 1.50 level I still like it short and EURGBP is now on a big weekly SR level from 2008 and could find support here or at 81.00 to help cable shorts.
Target for EURUSD is still 1.21 / 1.2150 for now
Target for AUDUSD 0.8575 / 0.8550
Target for AUDJPY 76.50

CRUDE short 76.00 stop 76.50 PT 73.75
CABLE short 1.4980 stop 1.5020 1st PT 1.4850
GOLD short 1234 stop 1238 PT 1215
GOLD stopped out (-1R)
AUDJPY short 77.35 stop 77.75 PT 76.50/80 addition
CRUDE closed breakeven - trade not working
AUDJPY stopped out (-1R)
GPBAUD short 1.7250 stop 1.7310 PT 1.70
USDCAD closed balance 1.0425 dbl top (+2.25R)
CHFJPY short 81.35 stop 81.50 PT 80 - TL/resistance line touch
AUDJPY short 78.00 stop 78.40 PT 76.50 - addition

Open positions:
AUDJPY short 80.55 stop 80.85  PT 76.80 / 75.60 - 1/4 position
AUDJPY short 78.00 stop 78.40 PT 76.50
CRUDE short 79.60 stop 80.10 PT 74.50 - 1/4 position
CRUDE short 78.60 stop 79.10 PT 74.50  - 1/4 position
GPBAUD short 1.7250 stop 1.7310 PT 1.70
CABLE short 1.4980 stop 1.5020 1st PT 1.4850
CHFJPY short 81.35 stop 81.50 PT 80


PS, thank you for the messages, I am fine.  The earthquake was scary, some pictures fell down but it didn't last very long.


Update:  USDJPY is at a daily trendline / channel bottom.  If it finds support here then the XXXJPY's aren't going to work.  I am watching this one.   Obviously if it falls out here then we look good.


GBPAUD at interesting S&R level and 50fib to reload shorts.  4hr chart


USDCAD has broken trendline resistance, 4hr chart.  This pair is normally a good leading indicator of which way we are going.  BUT is at 61.8fib of last swing so ... we watch


EURGBP weekly
Big support level has held ... and a good bounce


GBPJPY 4hr
Watching for a breakdown of this wedge

Wednesday, June 23, 2010

FOMC day

Quiet morning, England world cup day, Wimbledon and then this afternoon FOMC!
Another winning day for the bears yesterday and the S&P back below the 200 daily SMA.
Chinese banks apparently bought up the USD vs the Yuan again last night so no big change there.  I wonder how much longer we are going to keep watching it.
My view hasn't changed since Monday and I am still selling rallies and expect the down moves to continue for a bit longer.  I will post a chart if I see anything interesting.  


Sterling is well bid and GBPAUD is on the move this morning.  It has bounced off the 61.8fib retracement and should go to the 38.2 fib next at around 1.7250 which is also a good SR level.  I have taken a long entry but I might be a bit late for the train.


CRUDE is approaching the bottom of the rising channel.  I will add more short looking for a break of the channel at 74.50 / 75.00


EURGBP long 82.70 stop 82.57 PT 85.00
EURGBP stopped out (-1R)
Cable balance stopped out (-0.5R)
CRUDE short addition closed 50% @3R 77.10 (+1.5R)
AUDJPY closed 50% @3R 78.55 (+1.5R)
GBPAUD long 1.7050 stop 1.70 PT 1.7250
CRUDE original short closed 25% @6R 76.60 (+1.5R)
CRUDE short 76.40 stop 70.80 PT 74.50 bearflag break
CRUDE short today closed 50% @3R 75.20 (+1.5R)
AUDJPY short closed 25% @6R 78.75 (+1.5R)
AUDJPY addition closed 50% @3R 78.55 (+1.5R)
USDCAD closed 25% @6R 1.0350 (+1.5R)
CRUDE second short closed 25% @6R (+1.5R)
GBPAUD closed 1.7085 (+0.7R) - Pre Fed Announcement
CRUDE addition today closed 75.60 (+1R) - Pre Fed announcement
AUDJPY addition closed balance 78.20 (+2R) - Pre Fed announcement.

Open positions:
AUDJPY short 80.55 stop 80.85  PT 76.80 / 75.60 - 1/4 position
CRUDE short 79.60 stop 80.10 PT 74.50 - 1/4 position
CRUDE short 78.60 stop 79.10 PT 74.50  - 1/4 position
USDCAD long 1.020 stop 1.0175 PT 1.0460 - 1/4 position


Evening update.
Price spikes post FOMC have stalled at the 50fib retracement.  I am still in sell rally mode so will be adding some shorts.

Tuesday, June 22, 2010

UK Budget day

The new team Macro-Man thought the Chinese fake-out was one of the best jokes ever and a masterclass in Central Bank currency management. A great read.

We are about to get the UK budget and I am watching my cable position.  If it comes out sterling negative I will add some sterling shorts or I will add on a bounce because I think this pull-back week is set to continue.
Structure breaks have occurred and cable has fallen out of its ascending channel (4hr chart) and targets to the downside are 1.450, 1.4350 and a retest of the lows.
GBPJPY is testing trendline support and looks the best choice on a sterling-negative budget.  Every approach to 136 in this pair has been sold.
GBPCHF does not look like such a good short but EURGBP looks like a good buy with an upside target of 0.8550 and resistance at 84.20.
GBPAUD, my favourite risk meter still has a big gap to fill on the upside from Sunday's open and I would sell a spike up in that pair to 1.70 or 1.7050.

Gold finally fell off its perch and downside fibonacci targets are  1230, 1196 and 1168.
Apart from cable I expect dollar crosses to trade quietly before tomorrow's FOMC but it is Turnaround Tuesday so we shall see.


CRUDE closed 50% @3R 78.10 (+1.5R)
GBPUSD closed 50% @3R 1.4715 (+1.5R)
AUDJPY closed 50% @ 3R 79.65 (+1.5R)
CRUDE short 78.60 stop 79.10 - 50% retrace of Mon drop
AUDJPY short 79.60 stop 79.95 - addition
EURUSD short 1.2280 stop 1.2310 PT 1.2150
EURUSD stopped out (-1R)
USDCAD long 1.020 stop 1.0175 PT 1.0460
USDCAD closed 50% @3R 1.0275 (+1.5R)


Open positions:
AUDJPY short 80.55 stop 80.85 PT 79 - 1/2 + 79.60 stop 79.95
CRUDE short 79.60 stop 80.10 PT 77.40 - 1/2 + 78.60 stop 79.10
CABLE short 148.35 stop 1.4875 PT 1.47 - 1/2
EURUSD short 1.2280 stop 1.2310 PT 1.2150
USDCAD long 1.020 stop 1.0175 PT 1.0460

Monday, June 21, 2010

Monday 21 June

The Yuan announcement killed a few of my trades from Friday ...

NZDJPY short stopped out (-1R)
AUDUSD short stopped out (-1R)
AUDCHF balance stopped out 0.9730 (+0.5R)
USDJPY closed break even, trade not working.
EURCAD stopped out 1.26 break of trendline support (+0.55R)

AUDJPY short 80.55 stop 80.85 PT 79 - gap fill
CRUDE short 79.60 stop 80.10 PT 77.40 - gap fill
CABLE short 148.35 stop 1.4875 PT 1.47 -  dibs

I have the following positions open:

Update:
If the SPX closes the gap then it will break the channel support and back into the wedge ...